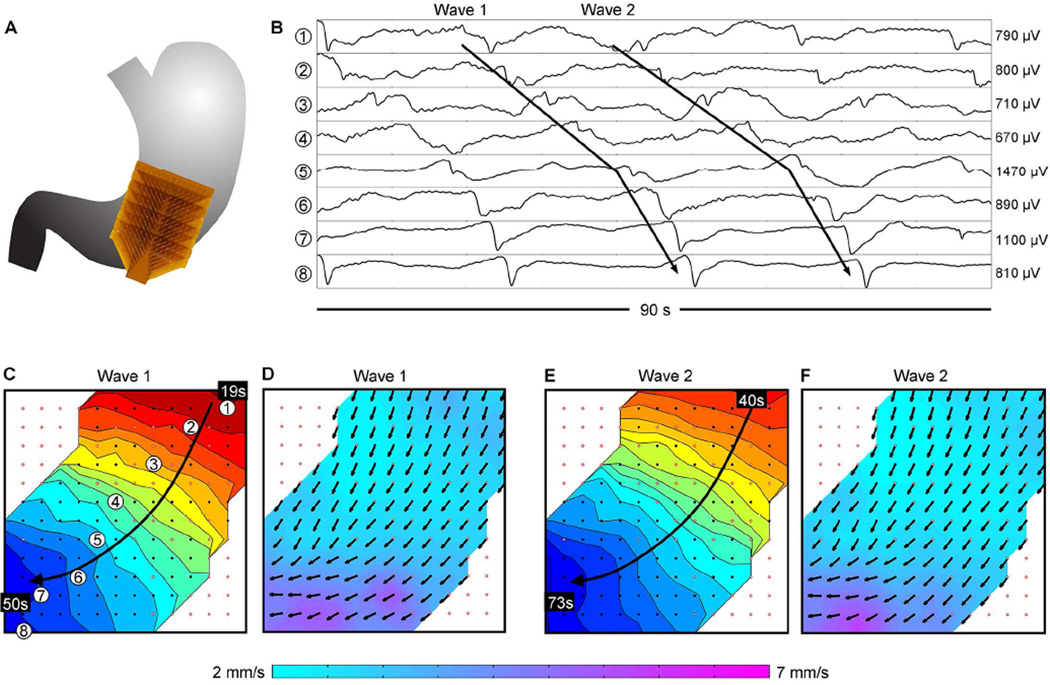
Figure 1.
Normal gastric slow wave propagation in a control. (A) Position of the array. (B) Electrograms from positions indicated in C (frequency, 2.8 ± 0.1 SD cycles/min). (C) Isochronal activation map of ‘Wave 1’ indicated in B, demonstrating normal antegrade propagation. Black dots represent electrodes, with white dots outlined red representing electrodes where activity was interpolated. Each color band shows the area of slow wave propagation per 2 seconds. (D) Velocity map of Wave 1, showing the speed (color spectrum) and direction (arrows) of the wavefront at each electrode. (E,F) Isochronal activation and velocity field maps of ‘Wave 2’ in B, demonstrating consistency of the antegrade propagation. See Supplementary Video 1 for animation.

