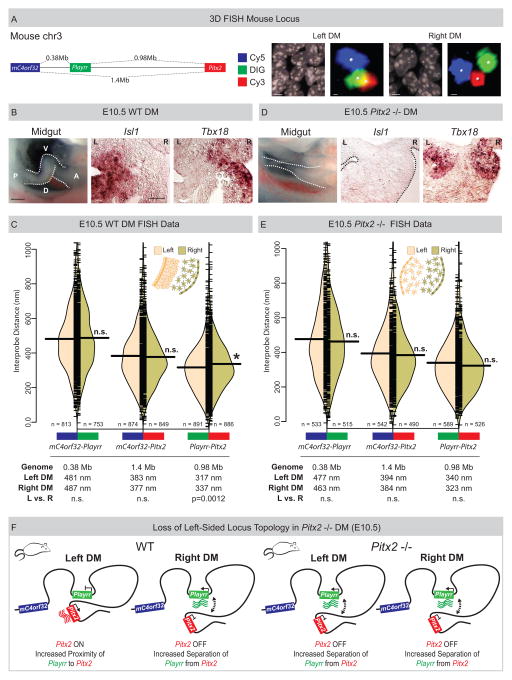
Figure 5. Spatial proximity of Playrr-Pitx2 chromatin interactions are dependent on Pitx2.
(A) Linear genomic distances in the mouse separating mC4orf32, Playrr, and Pitx2, marked with Cy5, DIG, and Cy3 labeled DNA probes, respectively. FISH labeled nuclei and individual loci in the left and right DM. (B) Chiral looping of the WT midgut is accompanied by left-specific Isl1 and right-specific Tbx18. A, anterior; P, posterior; D, dorsal; V, ventral. (C) Split bean plots (WT E10.5). Table summary of distances separating each probe pair in the linear genome or nucleus. (D) Altered midgut looping and right-isomerized DM in Pitx2-null embryos is evidenced by loss of left-specific Isl1 and bilateral Tbx18 expression. (E) Split bean plots (Pitx2-null E10.5). (F) Model of Pitx2 locus organization and gene expression in the mouse DM. Scale bars: (A) 2μm and 300nm for nuclei and individual loci, respectively; (B) 250μm, whole mount, 25μm, section. See also Figure S4.

