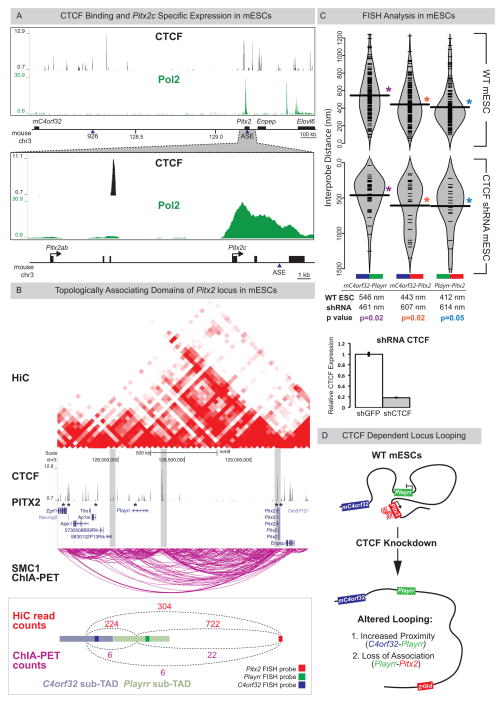
Figure 6. Playrr-Pitx2 chromatin interactions in mouse ES cells are dependent on CTCF.
(A) Top: CTCF binding at the Pitx2 locus (CTCF ChIP-seq); Bottom: mESCs preferentially express the asymmetric Pitx2c isoform (RNA Pol II ChIP-seq). (B) A topologically associating domain (TAD) spans the Pitx2 locus (HiC, red; Smc1 ChIA-PET, magenta). Vertical grey bars highlight boundaries between sub-TADs. CTCF binding sites (ChIP-seq) at both Pitx2 and Playrr are associated with Pitx2 binding (Pitx2-FLAG ChIP-seq, asterisks). Quantification of HiC (red) and Smc1 ChIA-PET (magenta) interactions between the genomic interval containing the Pitx2 FISH probe and the Playrr sub-TAD (light green) compared to the mC4orf32 sub-TAD (light blue). (C) FISH analysis of Pitx2 locus topology in WT (top) or shRNA mediated CTCF knockdown mESCs (bottom, y-axis has been inverted); table shows summary of distances separating each probe pair in the nucleus. CTCF expression via qRT-PCR in control vs CTCF k.d. mESCs, error bars ± S.E.M. (D) Summary of Pitx2 locus topology in mESCs. See also Figure S7.

