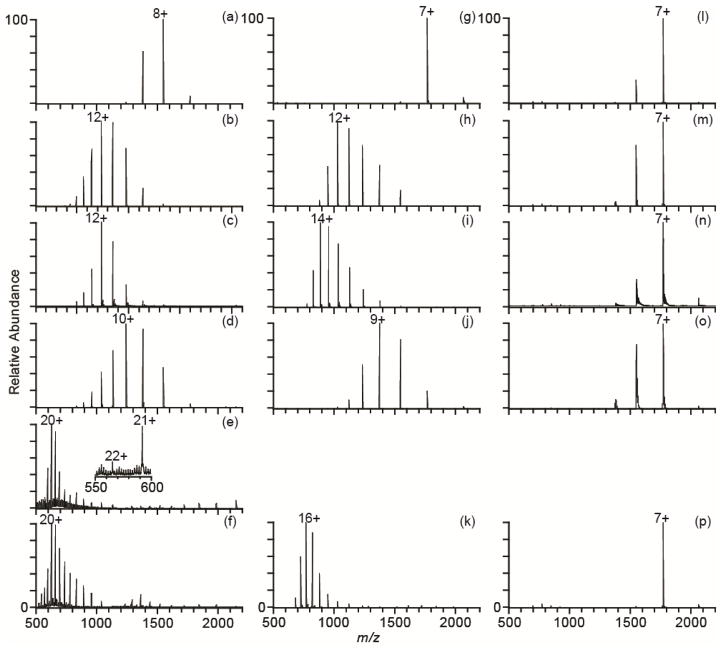
Figure 1.
NanoESI mass spectra of cytochrome c in water (left column), 200 mM ammonium acetate (middle column), and 200 mM ammonium bicarbonate (right column) with no supercharging reagent (a, g, l), 1.5% m-NBA (b, h, m), 5% sulfolane (c, i, n), 5% PC (d, j, o), 2% 2-thiophenone (e), and 2% HD (f, k, p).

