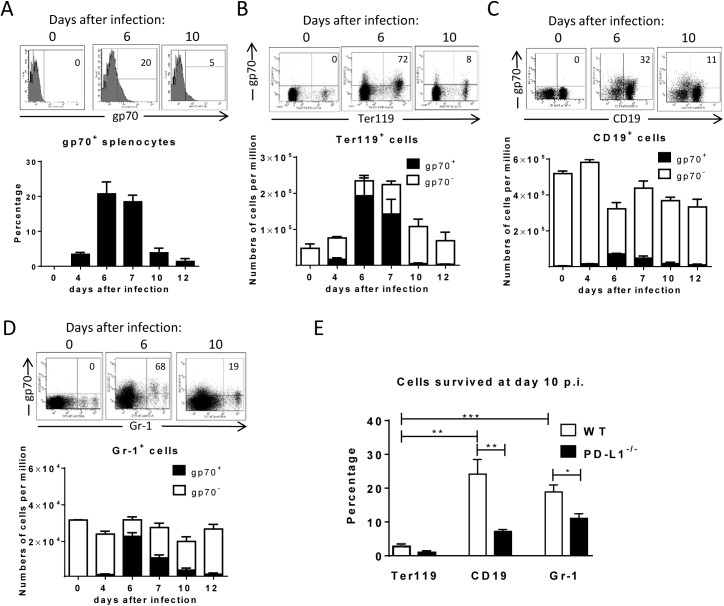
Fig 1. Target cell populations of FV infection.
C57BL/6 mice were infected with FV and splenocytes were isolated at different time points after infection. Multi-parameter flow cytometry analysis was used to compare the expression of FV gp70 antigen on the cell surface of different subpopulations of spleen cells. A. representative histograms of all nucleated cells positive for gp70 from naïve, 6 day and 10 day infected mice. The bars represent percentages of all nucleated spleen cells positive for gp70 for a group of 6–10 mice. B. The representative dot plots of Ter119+ cells positive for gp70 from naïve, 6 day and 10 day infected mice. Numbers in the upper right quadrat represent the percentage of gp70+ of Ter119+ cells. The bars represent the number of non-infected Ter119+ erythroblasts (gp70 negative) per one million nucleated cells (white columns) and the number of infected Ter119+gp70+ cells (black columns). C. The representative dot plot of CD19+ cells positives for gp70 from naive, 6 day and 10 day infected mice. Numbers in the upper right quadrat represent the percentage of gp70+ of CD19+ cells. The bars represents the number of non-infected CD19+ B cells (gp70 negative) per one million nucleated cells (white columns) and the number of infected CD19+gp70+ cells (black columns). D. The representative dot plot of Gr-1+ cells positives for gp70 from naive, 6 day and 10 day infected mice. Numbers in the upper right quadrat represent the percentage of gp70+ of Gr-1+ cells. The bars represents the number of non-infected myeloid Gr-1+ cells (white column) and the number of infected Gr-1+ gp70+ cells (black columns). E. The frequency of gp70+ cells at day 10 post infection in relation to the infected cells at day 6 from C57BL/6 (wt) (white bars) and PD-L1-/- (black bars) mice. Mean numbers plus SD from experiments with 5–8 mice are shown. Data was pooled from three independent experiments with similar results. Differences between frequencies of infected (gp70+) cells from different populations were analyzed by an unpaired t-test and are indicated in the figure (**p˂0.005, ***p˂0.0005).

