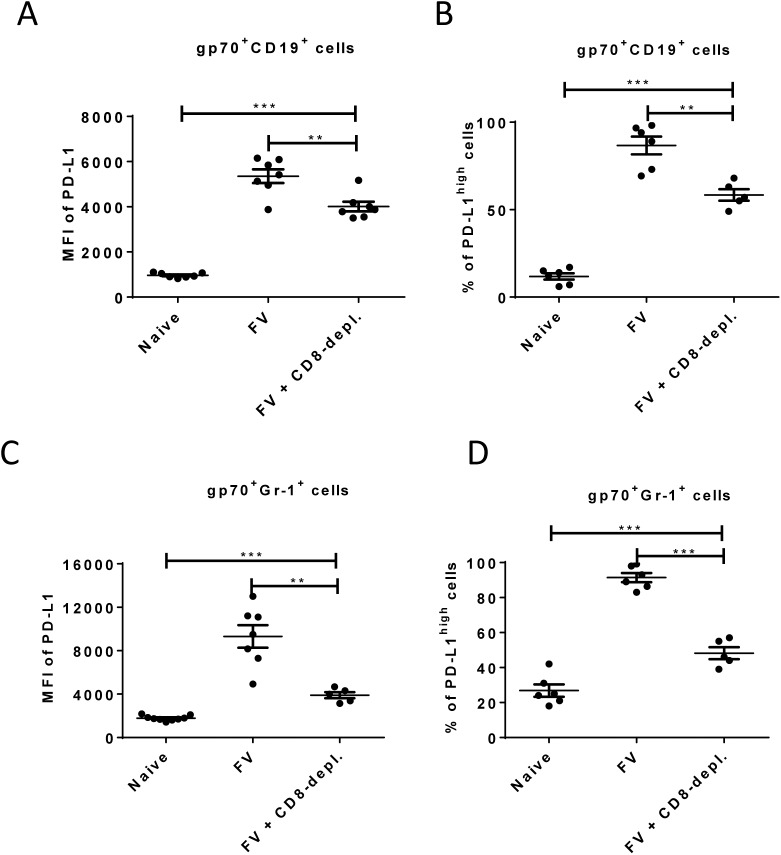
Fig 5. Expression of PD-L1 on FV infected cells from CD8+ T cells depleted mice.
C57BL/6 mice were infected with FV and treated with anti-mouse CD8 antibody. The spleen cells were isolated at day 10 after infection. Multi-parameter flow cytometry was used to compare the expression of PD-L1 on the cell surface of CD19+ cells (A) and Gr-1+ cells (C) and the percentage of infected (gp70+) CD19+ (B) and Gr-1+ (D) cells expressing high levels of PD-L1. Data was pooled from three independent experiments with similar results. Differences in PD-L1 expression on CD19+ cells or Gr-1+ cells from naïve mice and gp70+ CD19+ cells or gp70+ Gr-1+ cells from mice FV infected and FV infected and CD8+ T cells depleted mice were analyzed by one-way ANOVA was used with a Tukey post-test. Statistically significant differences between the groups are indicated in the figure (*p˂0.05, **p˂0.005, ***p˂0.0005).

