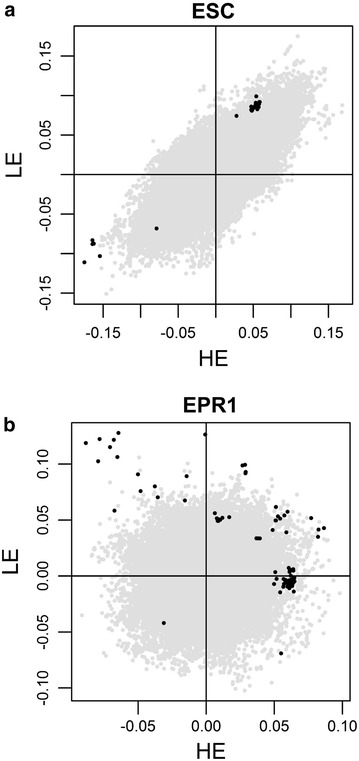
Fig. 1.

Examples of correlations between estimates of SNP effects for egg shell color (a) and egg production rate 1 (b) for the high-energy diet (x-axis) and the low-energy diet (y-axis). Chromosome-wide significant SNPs (P < 1 %) located in QTL that show an interaction with diet are plotted in black; correlations between estimates of SNPs effects are equal to 0.75 for egg shell color and to 0.16 for egg production rate
