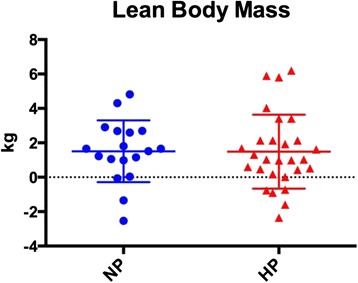
Fig. 2.

Each data point represents the change for an individual. The horizontal lines represent the mean ± SD. Legend: HP – high protein; NP – normal protein

Each data point represents the change for an individual. The horizontal lines represent the mean ± SD. Legend: HP – high protein; NP – normal protein