
Figure 1.
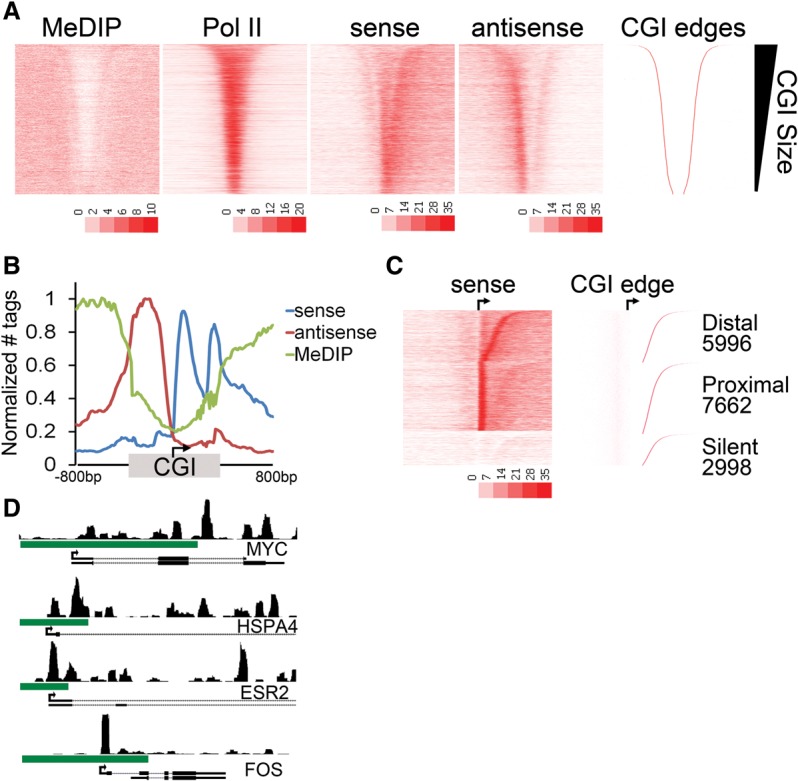
A second (distal) Pol II pause at the CGI shore. (A) Heatmap representation of MeDIP-seq, total Pol II ChIP-seq, and GRO-seq sense (plus strand) and antisense (minus strand) tag density is plotted for ±3 kb around the midpoint of the CGI and sorted by CGI size (CGI-associated promoters; n = 16,657). The upstream and downstream boundaries of the CGI domain (right) is shown for comparison. (B) Average tag densities of nascent transcripts (GRO-seq; sense, antisense) and DNA methylation (MeDIP-seq) across CGI-associated promoters. Promoters were oriented to the direction of transcription, and the distances from the TSS to the upstream and downstream CGI edge were independently scaled and anchored to the TSS (arrow). An additional 800 bp to either side of the CGI (unscaled) is included. Data are normalized between data sets by setting the maximum tags per 20 bp bin within each data set to one. (C) The relative GRO-seq tag density for the 100 bp under the proximal peak versus the 100 bp at the CGI edge was used to parse genes into proximal or distal pausing classes. Promoters with no tags in either region were considered silent. CGIs in each class were sorted by the distance from the TSS to the downstream CGI edge (indicated to the right). (D) Browser image of MCF7 GRO-seq sense tags covering an 8-kb window surrounding the promoter regions of MYC, HSPA4, ESR2, and FOS. Green bar indicates CGI.