
Figure 4.
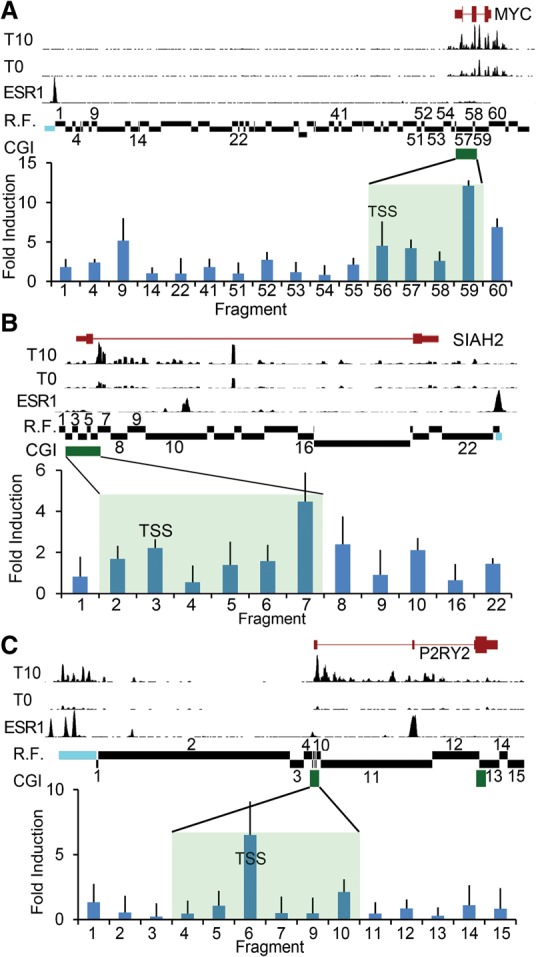
Distal enhancer interactions correlate with pausing class. A chromatin conformation capture (3C) assay was performed to investigate the interaction between known estrogen-bound enhancer elements upstream of the following: (A) MYC (shown is Chr 8: 128,679,000–128,763,000), (B) SIAH2 (Chr 3: 150,455,000–150,483,000), and (C) P2RY2 (Chr 11: 72,903,000–72,950,000) loci. The relative positions of the CGI (green bar, shaded region) and the fragment containing the TSS are indicated. Estrogen-depleted MCF7 cells were induced with 100 nM estradiol (E2) or vehicle (ethanol) for 10 min followed by crosslinking, restriction digestion, and ligation. An anchor probe was designed against the known estrogen receptor-bound enhancer (blue) and tested for ligation with the indicated restriction fragments (R.F.) by qPCR. Data are reported as mean ± SD of the fold-induction of E2-induced interaction relative to uninduced from three independent experiments assayed in triplicate. Shown for comparison are GRO-seq sense strand data from MCF7 cells depleted of estrogen for 3 d (T0) and induced with 100 nM estradiol for 10 min (T10) (Hah et al. 2011). For GRO-seq tracks, y-axis scale (total tag count every 10 bases): MYC = 1300, SIAH2 = 250, P2RY2 = 225. Shown for comparison are estrogen receptor alpha (ESR1) ChIP-seq data derived from GSM594602. For the ESR1 ChIP-seq track, y-axis scale (total tag count every 10 bp): MYC = 150, SIAH2 = 154, P2RY2 = 324. Data demonstrate estrogen-induced ESR1 binding at the enhancer and transcriptional activity at both the promoter and enhancer.