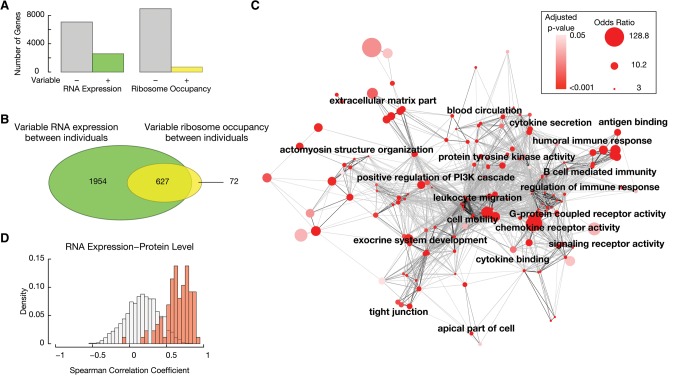
Figure 3.
Identification of genes with significant inter-individual variability in RNA expression and ribosome occupancy improves the ability to identify personal differences in protein levels. (A) Ribosome occupancy and RNA expression was modeled using a linear mixed model treating individuals as a random effect and mean expression as the fixed effect. A simulation-based exact likelihood ratio test (Scheipl et al. 2008) was used to compare the linear mixed model to a linear model that did not include the individual as a predictor. The number of genes that show significant inter-individual in RNA expression or inter-individual variation in ribosome occupancy is plotted (Holm's corrected P-value < 0.05). (B) The Venn diagram depicts the overlap between the two groups. (C) Enriched gene ontology (GO) terms among genes with significant inter-individual variation in both RNA expression and ribosome occupancy was determined using FuncAssociate (Berriz et al. 2009). Cytoscape (Smoot et al. 2011) was used to visualize the enriched GO terms (permutation test corrected P-value < 0.05, odds ratio > 3) (Supplemental Table S2). Nodes correspond to GO terms and are colored by the corrected P-value. The size of the node is proportional to the logarithm of the odds ratio. The similarity between GO terms was quantified using Kappa similarity. The strength of the similarity was visualized using darker edge colors (Supplemental Methods). An edge-weighted spring embedded layout is shown. (D) For each gene, Spearman correlation was calculated between individual specific RNA expression and relative protein levels. The distribution of the correlation coefficients was plotted as a density. Genes that showed significant variation in both RNA expression and ribosome occupancy between individuals are plotted with red bars and genes without detectable variation in RNA expression and ribosome occupancy are shown with white bars.

