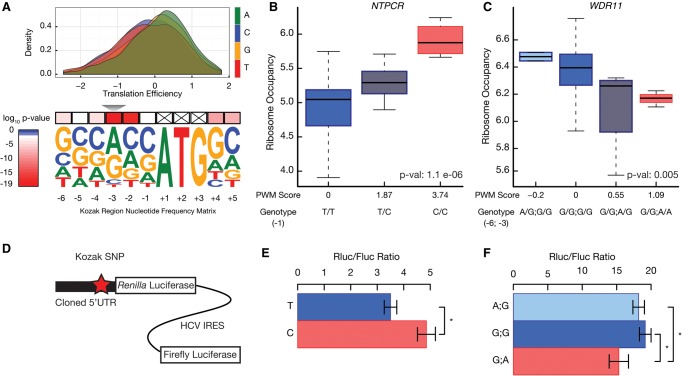
Figure 5.
Nucleotide variants modulating the sequence around the translation initiation site alter translation efficiency. (A) The Kozak region is defined as the 6 nt preceding and 2 nt following the start codon. The derived position weight matrix was visualized using WebLogo (Crooks et al. 2004). The upper panel shows the effects of each nucleotide at the −3 position on translation efficiency. The effect of nucleotides on translation efficiency was tested using the Kruskal–Wallis test. (B) The effect of a Kozak region variant on the ribosome occupancy of NTPCR was assessed using a linear model (P-value = 1.1 × 10⁻⁶). A boxplot was used to visualize the distribution of ribosome occupancy for individuals with given genotypes. The horizontal bar reflects the median of the distribution and the box is drawn to depict the interquartile range. (C) WDR11 had two naturally occurring SNPs in its Kozak region. An additive model was adopted to calculate the change in the position weight matrix score of the Kozak region. (D) 5′ UTRs with or without Kozak variants were cloned into a translation efficiency reporter. The reporter expresses a biscistronic mRNA, in which the Renilla luciferase is translated under the control of the cloned 5′ UTR, and the firefly luciferase is translated under the control of Hepatitis C virus (HCV) internal ribosome entry site (IRES). (E,F) The ratio of Renilla to firefly luciferase activity was plotted for NTPCR (E) and WDR11 (F). Error bars represent SEM. The difference between the ratios was assessed using a two-sided two-sample t-test. (*) P-value < 0.05.

