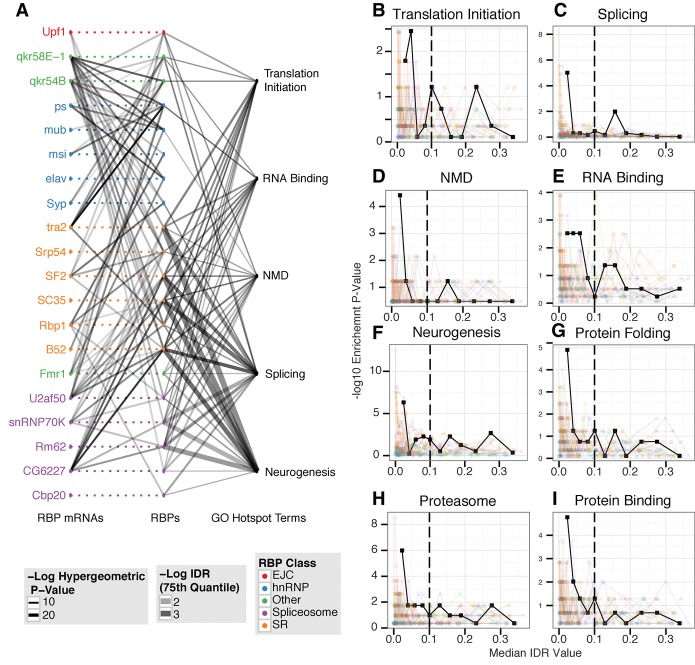
Figure 2.
RBP-RNA–binding network. (A) This plot presents a global view of the RNA–protein interaction network. Each point in the center column represents an RBP (RIP-seq experiment). Corresponding points on the left represent each RBP's mRNA. Dashed lines represent hypothetical binding events that cannot be observed due to the overexpressed background. Lines join an RBP and an RBP's mRNA if significant binding is observed (Methods), and the lines are shaded according to the strength of binding (−log IDR value) for this interaction. Points on the right represent the set of genes annotated with the corresponding hotspot GO term. Lines are drawn between an RBP and a hotspot GO term if the bound set of RNAs significantly overlaps (P < 0.01) the GO term set. The thickness of these lines represents the significance of the overlap between the corresponding sets of RNAs. The shading of these lines indicates the binding strength of this set of bound RNAs (defined as the 75th percentile of the –log IDR values for the bound RNAs). (B–I) HOT RNAs are driven by the most enriched RNAs. Each plot represents the enrichment for a single hotspot GO term gene set across all experiments. The one solid line represents the median IDR value for each RNA for of all RBPs, and each transparent line represents a single RBP. Each point represents 100 RNAs binned by IDR value in increasing order. The y-value for each point represents the −log hypergeometric P-value for the overlap between the 100 bound RNAs and the GO term gene set. Each plot represents the “down-the-rank-list” enrichment for a particular hotspot GO term: (B) translation initiation, (C) splicing, (D) NMD, (E) RNA binding, (F) neurogenesis, (G) protein folding, (H) proteasome, and (I) protein binding.

