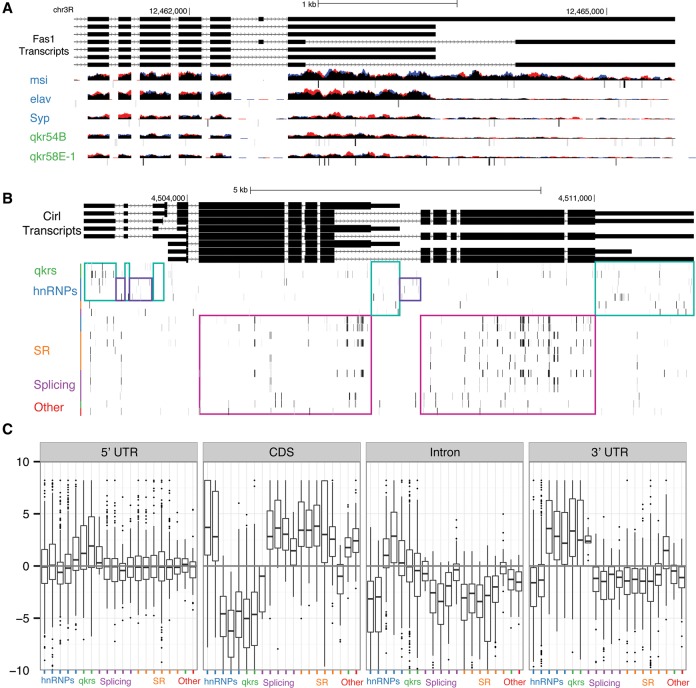
Figure 4.
Gene structure binding. (A) The 3′ UTR region of the Fas1 locus, where we observe MSI binding specifically to the 3′ UTR extended isoform. It has been previously reported that this 3′ UTR extension is controlled by ELAV. (B) Cirl is a hotspot RNA in our analysis (bound by, in order of lowest to highest IDR value, SRP54, U2AF50, B52, RBP1, RM62, CG6227, MUB, TRA2, QKR58E-1, PS, and SNRNP70K). We note that motifs hits cluster in the gene structure regions. (C) This plot represents the enrichment of each RBP's motif along gene structure (5′ UTR, CDS, 3′ UTR). The annotation was collapsed into regions that are only observed as a particular gene structure. Significant motif k-mers (top 1% most likely k-mers given the RBP PWM) are then identified across the transcriptome and overlapped with the gene structure. Each point represents the enrichment of motif-hit proportion within a gene element over the length of the gene structure element at the locus. Note that only enriched loci for each RBP with at least 20 motif hits are plotted.

