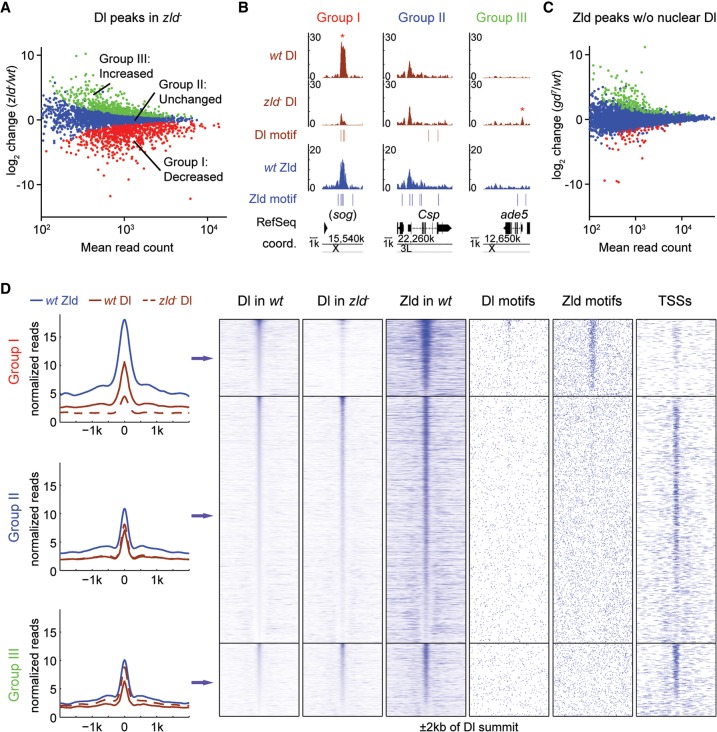
Figure 1.
In the absence of Zld, Dl is lost at developmental enhancers and redistributes to accessible regions such as promoters. (A) MA plot of differential Dl binding in zld− versus wild-type (wt) embryos. The x-axis represents the mean of normalized Dl reads per peak; the y-axis represents the log2 fold-change of normalized reads per peak between the genotypes. Significantly decreased peaks (Group I, red), not significantly changed peaks (Group II, blue), and significantly increased peaks (Group III, green) were identified by DESeq with FDR < 0.1. (B) Integrated genome browser (IGB) views showing examples of Dl peaks (brown tracks) within the three Dl-peak groups (y-axis represents normalized read counts), together with nearby Zld binding (blue track), as well as Dl and Zld motifs. For the sog locus, the shadow enhancer that lies ∼20 kb upstream of the TSS is shown (Hong et al. 2008). Asterisks denote peaks significantly changed in zld−. (C) MA plot as shown in A of differential Zld binding in gd7 (in which no Dl activation occurs) versus wt embryos. The number of significantly changed peaks is much smaller. (D) Metaprofiles and heatmaps of normalized Dl and Zld ChIP reads for each Dl-peak group, along with nearby Dl and Zld motifs, and annotated TSSs. All regions are centered on the Dl summit (in wt) and extend to each side by 2 kb. Note that wt Dl binding within Groups II and III is on average much lower than within Group I. Note also that only Group I is highly enriched for Dl and Zld motifs and has significantly less TSSs than the other two groups, consistent with the hypothesis that they are enriched for enhancer regions.

