Figure 4.
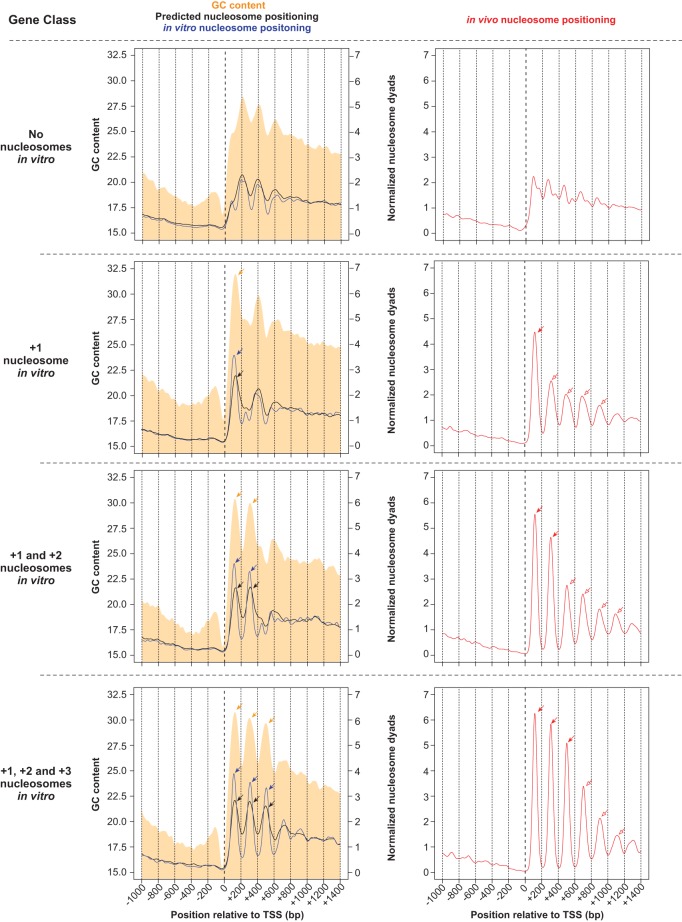
Standard in vitro nucleosomes coincide with GC content oscillations and are associated with increased nucleosome positioning in vivo. Tetrahymena genes were classified according to the number of standard in vitro nucleosomes downstream from their TSS. Nucleosome positioning data are obtained from in vitro (blue line) and in vivo (red line) experiments, as well as from predictions of a thermodynamic model formulated by Kaplan et al. (2009) (black line). Log-phase MNase-seq data were used as the in vivo sample. GC content is represented as a filled orange curve. Different gene classes are separated by horizontal dotted lines. The nucleosome-depleted region upstream of standard nucleosomes coincides with GC-poor DNA. Pronounced peaks in GC content (orange arrows) exhibit a ∼200-bp periodicity, and coincide with nucleosome positions in vitro (blue arrows). This is consistent with GC-rich DNA being intrinsically favorable for nucleosome formation. Genes with no standard nucleosomes in vitro (top row) exhibit an indistinct nucleosome pattern in vivo (right panel). On the other hand, genes with a +1 nucleosome in vitro (blue arrow within left panel) exhibit increased nucleosome positioning in vivo, not only at the +1 position (red filled arrow), but also around this region (red open arrows). A model based on nucleosome sequence preferences successfully predicts in vitro nucleosome positions (black arrows), which in turn overlap with in vivo nucleosomes (red filled arrows). However, the model fails to predict in vivo nucleosomes in surrounding regions (red open arrows), suggesting that such nucleosomes are instead positioned by trans-acting factors. These trends are also observed in other gene classes, with varying numbers of nucleosomes in vitro. DNA sequences favorable for nucleosome formation may thus function as nucleation sites that aid trans-acting factors in positioning nucleosomes in flanking regions in vivo.

