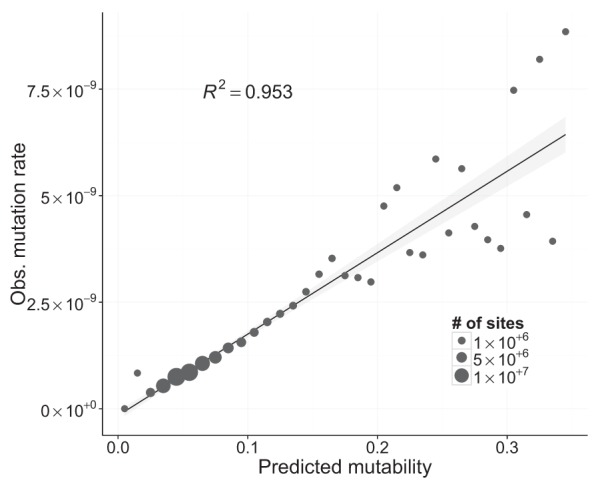
Figure 5.

Linear fit between observed mutation rate and predicted mutability. Mutability was estimated using a logistic regression, where the presence or absence of a mutation was the response variable, and a variety of genomic properties were used as predictors (see Supplemental Table S2). Each point represents multiple genomic sites placed in discrete bins (width = 0.01) based on each site's mutability score. The size of each point is proportional to the number of sites in the genome with a given mutability. Observed mutation rates for each point were calculated as the number of observed mutations divided by the total number of callable sites-generations in that bin. The linear regression was weighted by the number of sites in each bin, and the shaded gray area around the line represents the 95% confidence region.
