Figure 6.
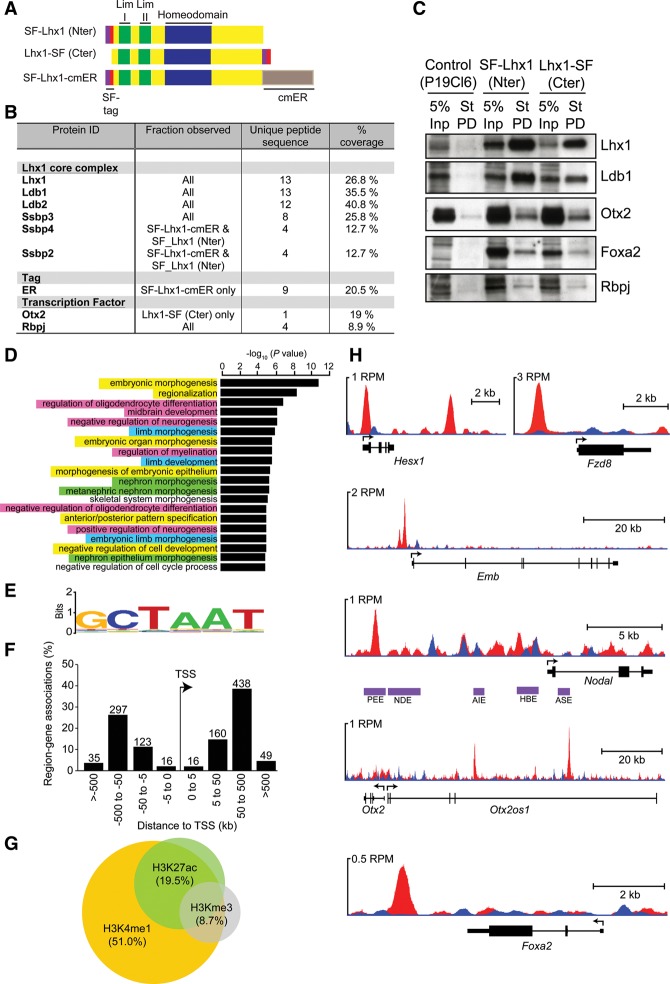
Identification of Lhx1 interaction partners and candidate target genes. (A) Schematic representation of SF epitope-tagged expression constructs. (B) Summary of select Lhx1 protein partnerships identified by MS analysis. The percentage of coverage for each protein, the number of unique peptide sequences, and corresponding pull-down fractions are shown. (C) Western blot analysis of StrepTactin pull-down (St-PD) experiments. As a positive control, 5% of the input (Inp) sample was analyzed. Proteins, indicated at the right, were enriched in test pull-down fractions (SF-Lhx1 Nter and Lhx1-SF Cter). (D) Functional annotation analysis using GREAT reveals that Lhx1 preferentially binds to genes associated with development, differentiation, and morphogenesis processes; namely, embryonic (yellow highlight), neural (pink), renal (green), and limb (blue) Lhx1-expressing tissues. (E) De novo motif analysis (Weeder) reveals an enrichment of a TAAT-containing sequence underlying Lhx1 peaks. (F) The distance from the nearest transcription start site (TSS) for each ChIP-seq peak and the number of peaks within each grouping are indicated. (G) Lhx1 ChIP-seq peaks were compared with previously reported histone modification profiles in mouse ES cells. (H) University of California at Santa Cruz (UCSC) track view of ChIP (red) and input (blue) wiggle plot overlays showing enrichment of Lhx1 ChIP-seq density at Hesx1, Fzd8, Embigin, Nodal, Otx2, and Foxa2. Purple boxes indicate the positions of previously mapped Nodal enhancer elements. (RPM) Reads per million.

