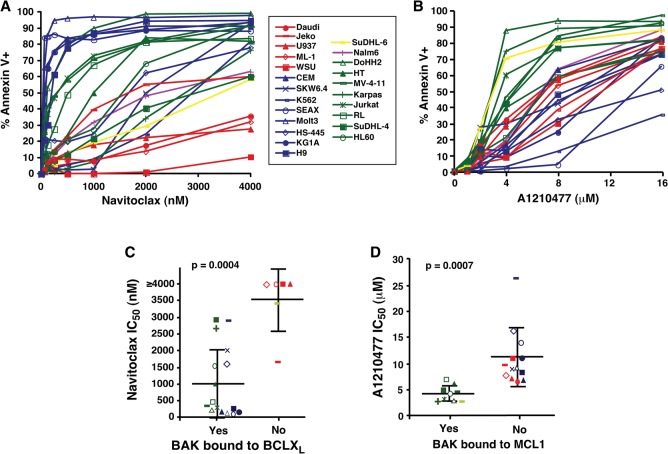
Figure 4.
Sensitivities of cell lines to navitoclax and A1210477 correlate with BAK binding status. (A,B) After the cell lines were treated with navitoclax (A) or A1210477 (B), the percentages of Annexin V-positive cells were assessed by flow cytometry. Graphs show the average of three independent experiments. Symbols and line colors represent different BAK binding statuses. (Red) No binding; (blue) BAK bound to BCLXL only; (yellow) BAK bound to MCL1 only; (purple) unknown binding partner; (green) BAK bound to multiple partners. (C,D) Concentrations of navitoclax (C) or A1210477 (D) required to induce apoptosis in 50% of cells (IC50) grouped according to BAK binding status as determined in Figure 3 and Supplemental Figure S5. Symbols for each cell line correspond to the key between A and B. Heavy horizontal lines represent the mean, and error bars indicate the SD of the indicated groups of lines.

