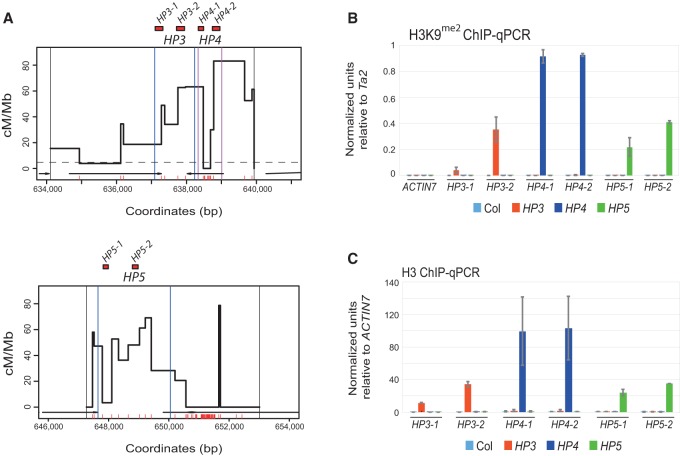
Figure 3.
Chromatin analysis of H3K9me2 and nucleosome density at the 3a and 3b hot spots. (A) Plots showing the HP targeted regions within the 3a (top) and 3b (bottom) hot spots, including the position of amplicons analyzed by ChIP-qPCR (red boxes) (Supplemental Table 4). Vertical black lines indicate pollen-typing allele-specific primer-binding sites, and vertical blue or purple lines indicate hairpin target regions. (B) ChIP-qPCR analysis of H3K9me2 showing normalized units of PCR enrichment in wild-type Col (light blue), HP3 T3 (orange), HP4 T3 (dark blue), and HP5 T2 (green) lines. Values were normalized against the Ta2 transposon (Johnson et al. 2002). (C) ChIP-qPCR analysis of unmodified H3 showing normalized units of enrichment in wild type, HP3 T3, HP4 T3, and HP5 T2, as in B. Values were normalized against ACTIN7 (At5g09810). Error bars represent standard deviation of biological replicates.

