Figure 4.
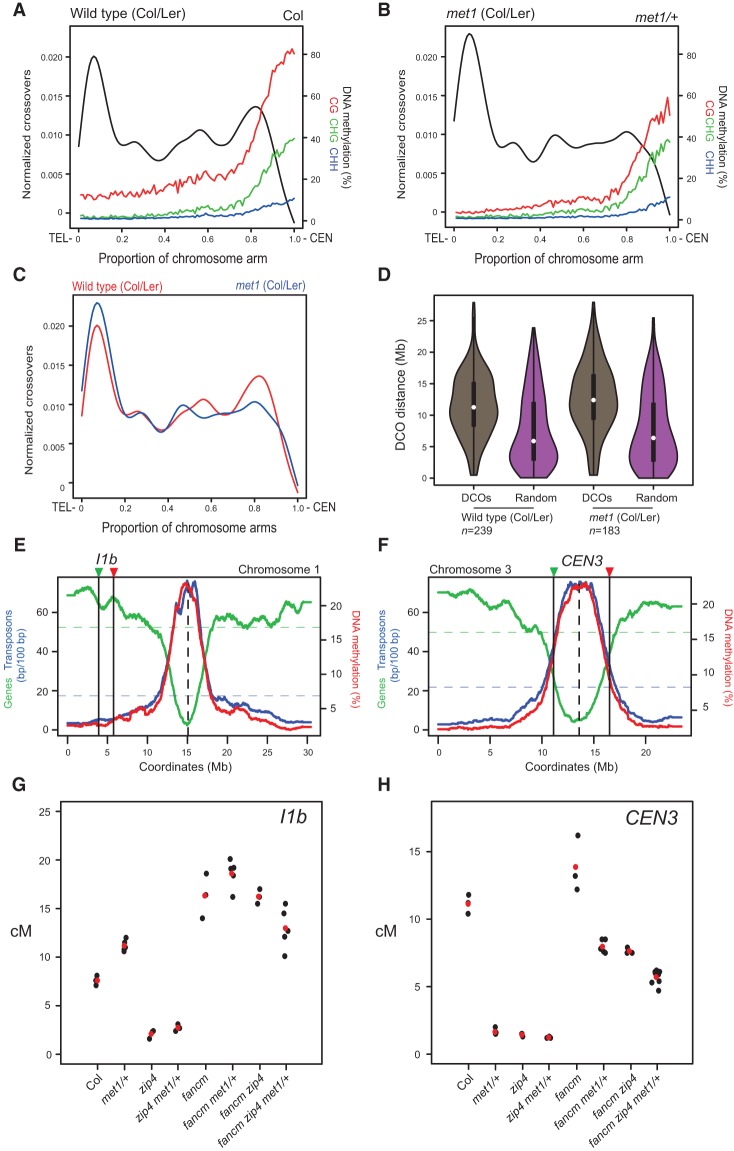
Epigenetic remodeling along chromosome arms in met1 involves interfering crossovers. (A) Normalized wild-type (Col/Ler) crossovers (black) from a male backcross population are plotted along the proportional length of chromosome arms, orientated from telomere (TEL) to centromere (CEN). Wild-type (Col) percentage of DNA methylation is plotted on the same X-axis. (Red) CG; (green) CHG; (blue) CHH. (B) As in A except that normalized crossovers are from a met1 (Col/Ler) male backcross population, and DNA methylation is from met1-3/+. (C) Normalized crossovers from wild-type (red) and met1 (blue) backcross populations plotted and overlaid as in A and B. (D) Violin plots showing the distribution of physical distances (in megabases) between double crossover (DCO) events in wild-type and met1 male backcross populations. Observed double crossovers (brown) are compared with distances for an equivalent set of randomly distributed sites (purple). (E) Gene (green) and transposon (blue) sequence density (base pairs per 100 bp) along Arabidopsis chromosome 3. Wild-type percentage of total DNA methylation (red) calculated for adjacent 10-kb windows. The centromere is indicated by the vertical dotted line and the I1b fluorescent interval is indicated by vertical black lines and colored triangles. (F) As in E but for chromosome 3 and the CEN3 interval. (G) I1b genetic distances (in centimorgans) in the indicated genotypes. Replicate measurements are indicated by black dots, and mean values are indicated by red dots. (H) As in G but for CEN3 genetic distances.

