Figure 5.
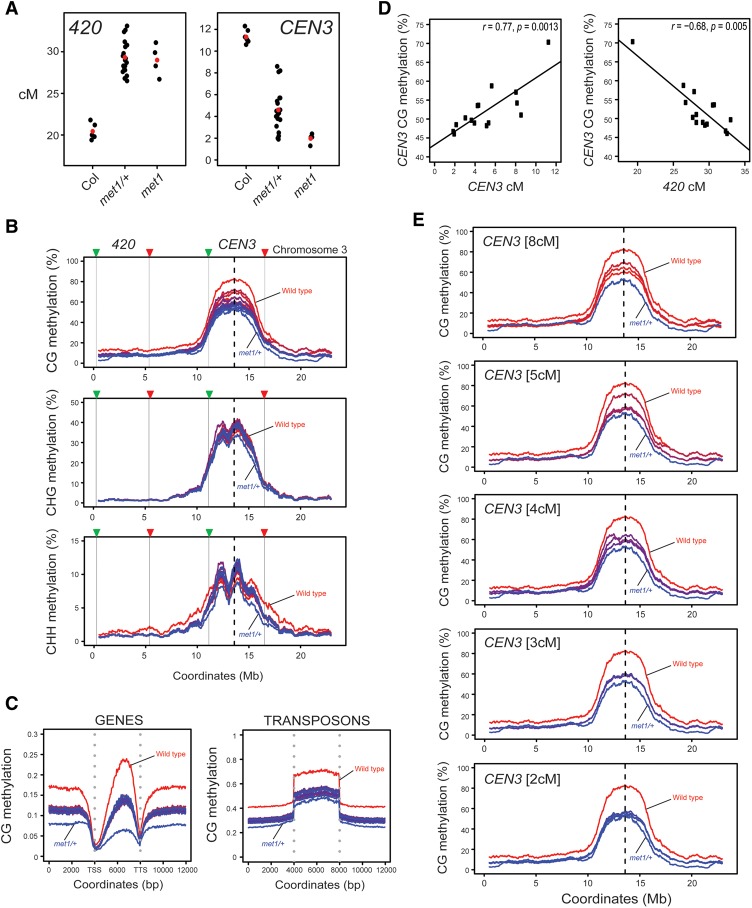
Loss of centromeric CG DNA methylation drives crossover remodeling in met1. (A) 420 and CEN3 genetic distances (in centimorgans) in the indicated genotypes. Replicate measurements are indicated by black dots and mean values are indicated by red dots. (B) DNA methylation (percentage) along chromosome 3 is shown separately for CG, CHG, and CHH sequence contexts. Wild-type (red) and met1/+ (blue) controls are shown, along with 14 420-CEN3 met1/+ F1 samples that are color-coded according to the CEN3 recombination rate. (Red) Highest; (blue) lowest. The centromere is indicated by vertical dotted lines, and the 420 and CEN3 fluorescent intervals are indicated by the vertical black lines and colored triangles. (C) Average CG methylation within scaled windows across all genes and transposons and in 4-kb upstream and downstream regions. Samples are color-coded according to CEN3 centimorgans, as in B. Vertical dotted lines indicate gene TSSs and TTSs or transposon start and end coordinates. (D) Correlations between CEN3 CG methylation and CEN3 or 420 genetic distances (in centimorgans). Spearman's correlation values, r, are shown with P-values. (E) Plots show CG DNA methylation for chromosome 3 (as in B) separately for groups of 420-CEN3 F1 met1/+ individuals, according to CEN3 genetic distance (as indicated).

