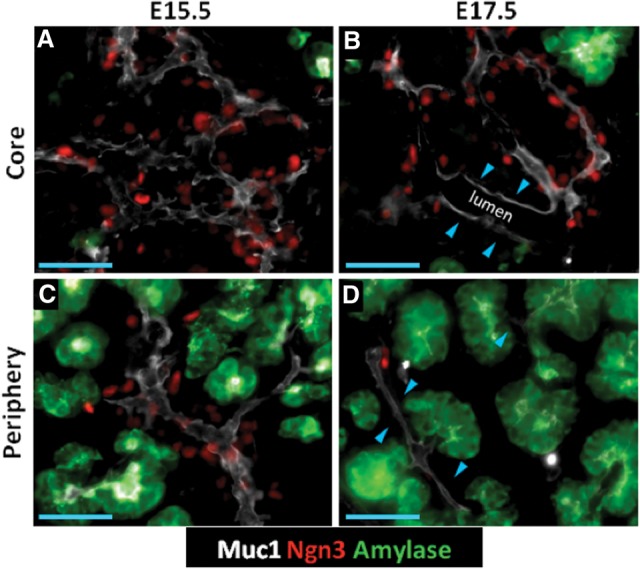
Figure 1.

Ngn3+ populations show nonrandom localization patterns within the trunk. (A–D) Epifluorescence images of core and peripheral regions in 10-µm cryosections showing Muc1, Ngn3, and amylase. (A,C) Ngn3+ cells distributed over the Muc1+ lumen surface. (B,D) Regions of lumen where Ngn3+ cells are reduced in number. (Blue arrowheads in B) Enlarged lumen in the core; (blue arrowheads in D) lumen interconnecting amylase+ tips. Bars, 50 μm.
