Figure 2.
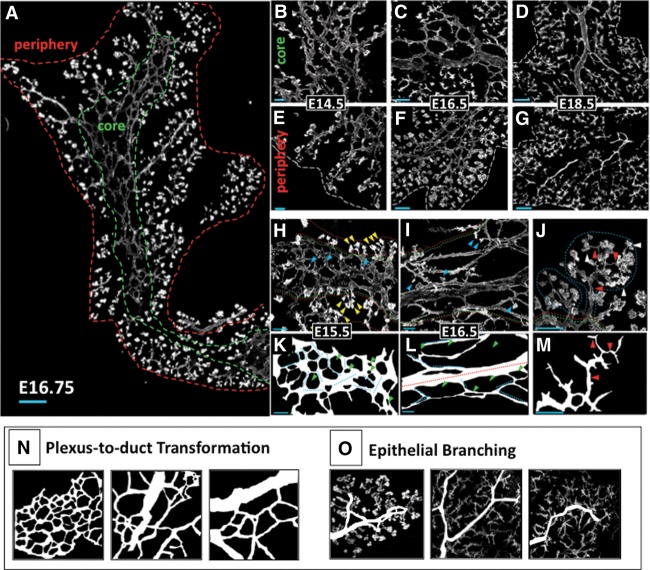
Epithelial morphogenesis comprises plexus remodeling in the core and epithelial branching in the periphery. (A) Composite 10× images of a 45-µm-thick cryosectioned dorsal pancreas at E16.75. Green and red dashed lines bound the core and periphery, respectively. (B–D) Muc1-labeled 35-µm-thick cryosections showing typical progression through plexus expansion and duct transformation in the core. (E–G) Epithelial branching in the periphery. (White dashed line) Outer organ boundary. (H–M) Confocal z-stacks show features of plexus (H,K), duct (I,L), and ductal branch (DB) (J,M) states. (I,J) Core (green dashed line) and periphery (red dashed line) are shown. Small, unclefted DBs in the core (blue arrowheads), clefted DBs in the periphery (yellow arrowheads in H), lobes of DBs (blue dashed line), Muc1+ lumen of proacinar tips (white arrowheads in J), and connecting lumen (red arrowheads in J) are shown. (K–M) Line traces of lumen from H–J. Individual segments of plexus (dotted light blue lines) and core duct states (red dashed line) are shown. Note the increase in lumen diameter and the continuous directionality across a representative 40× field of the duct state in L relative to the plexus in K. (Green arrowheads) Unlabeled cell fields (epithelial and parenchymal) bounded by Muc1 signal. (N,O) Traced representations of the processes of plexus-to-duct transformation in the core and epithelial branching in the periphery. Bars: B,E,H-J, 20 μm; C,F, 50 μm; A,D,G, 100 μm.

