Figure 3.

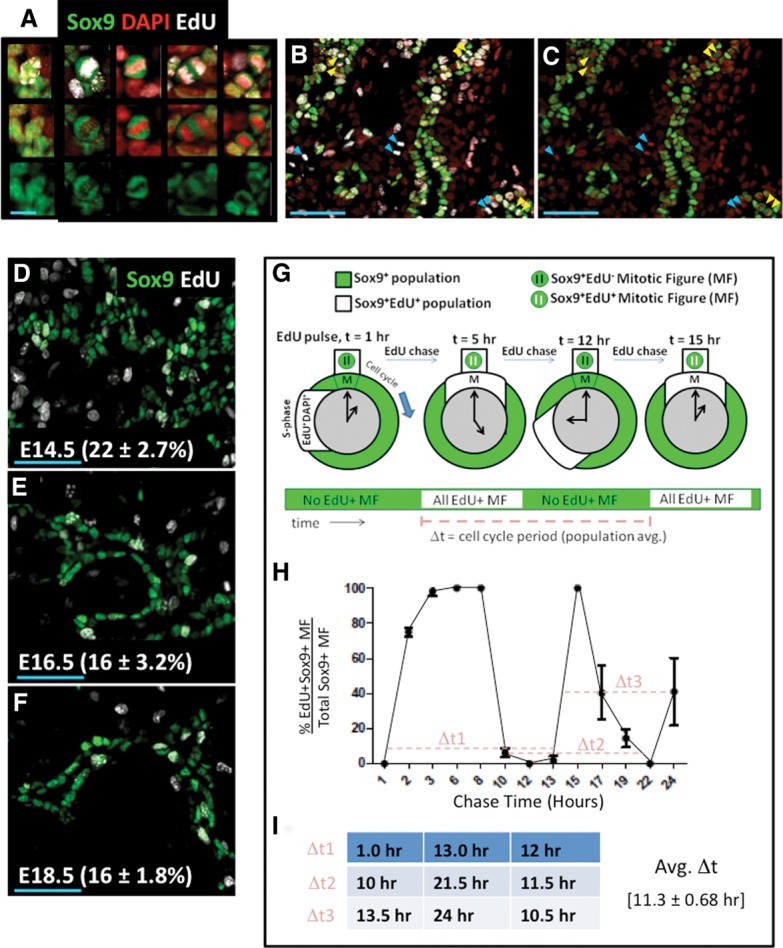
EdU pulse-chase analysis measured average cell cycle period in Sox9+ cells. (A) Individual Sox9+EdU+ cells captured before and during mitosis. (Left to right) Sox9+ cells not in mitosis and MFs in prophase, metaphase, anaphase, and cytokinesis. Bar, 10 μm. (B,C) MFs observed in a representative 20× field at E14.5, 3 h after EdU injection. (Yellow arrowheads) Sox9+EdU+ MFs; (cyan arrowheads) Sox9–EdU+ MFs; (doublet arrowheads) MFs after DNA segregation into daughters. Bars, 50 μm. (D–F) One-hour S-phase indices were similar from E14.5–E18.5. Bar, 50 μm. (G) Diagram of EdU pulse chase in replicating Sox9+ populations. Sox9+ cells undergoing S phase were labeled by EdU. EdU+Sox9+ populations (white) undergo and complete mitosis (t = 5 h) before undergoing a subsequent round of mitosis (t = 12–15 h). Rounds of mitosis can be tracked by monitoring waves of EdU positivity in the Sox9+ MF states (green and white bar over time). Time differences (“Δt”s) are determined from intervals between waves of EdU+ MFs. (H) Twenty-four-hour EdU pulse-chase analysis of cell cycle period in Sox9+ populations, with “Δt”s represented by a dashed light-red line. (I) Calculation of average Δt from pulse-chase measurements in H. Error bars are SEM.
