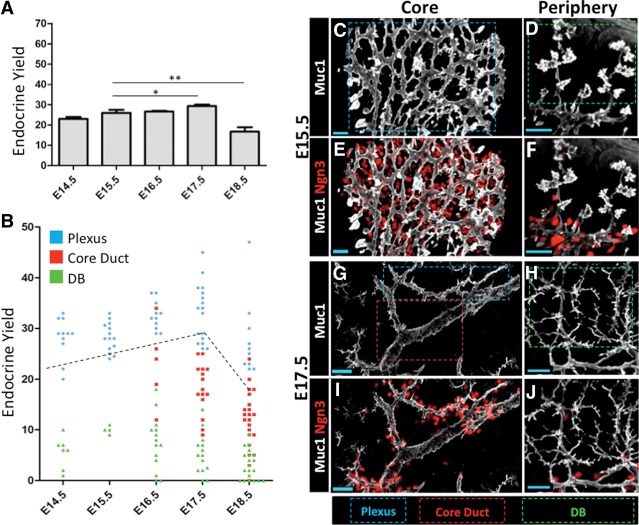
Figure 5.
Endocrine differentiation is enriched in the plexus state. (A) Bulk endocrine yields determined from analysis of 10-µm sections. Thirty percent of the dorsal pancreas was scored. Error bars are SEM. (*) P = 0.1161; (**) P = 0.0249, Student's t-test. (B) Comparison of endocrine yield in the plexus, duct, and DB states. Each point represents endocrine yield summed from individual 35- to 50-µm-thick 40× z-stacks. E14.5–E18.5 plexus versus DB, P < 0.0001; E17.5 and E18.5 plexus versus duct, P < 0.0001; E16.5 plexus versus duct, P = 0.0019. Error bars are SEM; Student's t-test. Bulk endocrine yield as determined in A (black dashed line). (C–J) Representative images of Ngn3+ cells in relation to the plexus (blue dashed box), duct (red dashed box), and DB (green dashed box) states. Bars, 20 μm.

