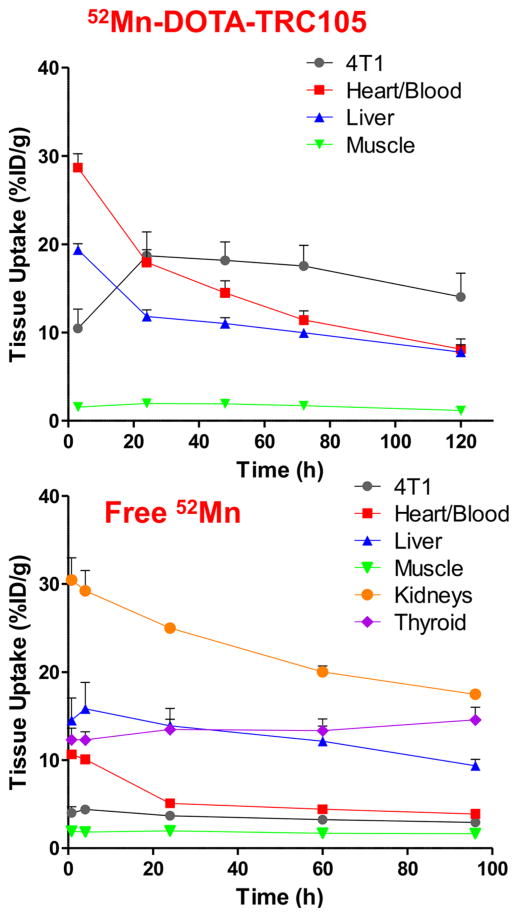
Figure 3.
Time activity curves (TACs) acquired from ROI analysis of PET images obtained in subjects injected with 52Mn-DOTA-TRC105 (n = 3) and with Free 52Mn (n = 4). Error bars represent the standard deviation, and are displayed one-sided for visual clarity. The Heart/ Blood TAC uses an ROI drawn over the left ventricle and does not differentiate myocardium from the blood pool.

