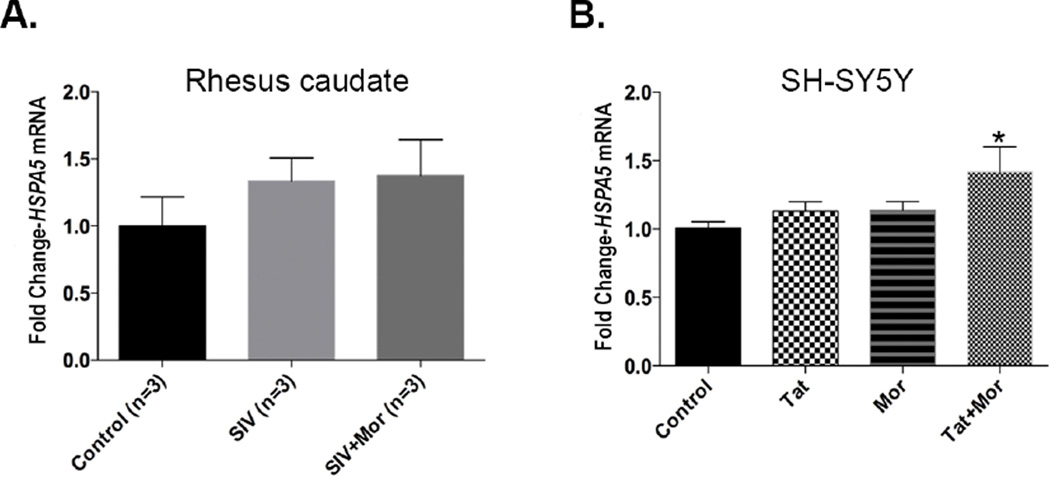
Figure 2.
(A) Real time PCR analysis showing an increase in HSPA5 expression in the basal ganglia of SIV+Morphine group compared to the SIV only and control groups (B). Increasing trend in HSPA5 expression in SH-SY5Y neuroblastoma cells treated alone with 50 ng Tat, 0.1 µM or in combination of Tat and morphine for 24 h. in vitro data represented as Mean ± SEM of 6 independent experiments. One-way ANOVA with Dunnett’s multiple comparison test was used to determine the significance for both in vivo and in vitro data. *p<0.05 versus control.

