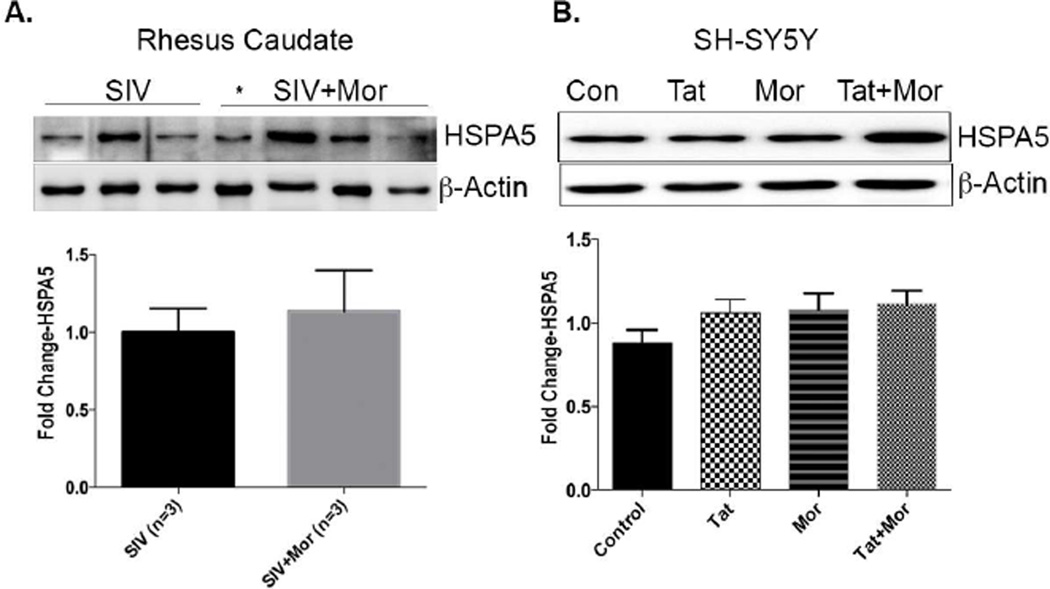
Figure 3.
(A) Western blot analysis on rhesus caudate synaptosomes showing increased HSPA5 expression in the SIV+morphine group compared to SIV only group along with the bar graph (bottom) showing the quantification. * Represents a rapid progressor that was excluded from the analysis. (B) Representative western blot showing an increase in HSPA5 expression in the Tat+morphine treated group compared to the controls along with the bar graph (bottom) showing the quantification. In vitro data represented as Mean ± SEM of 6–8 independent experiments. Unpaired students t-test was used to determine the significance for the in vivo data. For the in vitro data, a Oneway ANOVA with Dunnett’s multiple comparison test was used to determine the significance.

