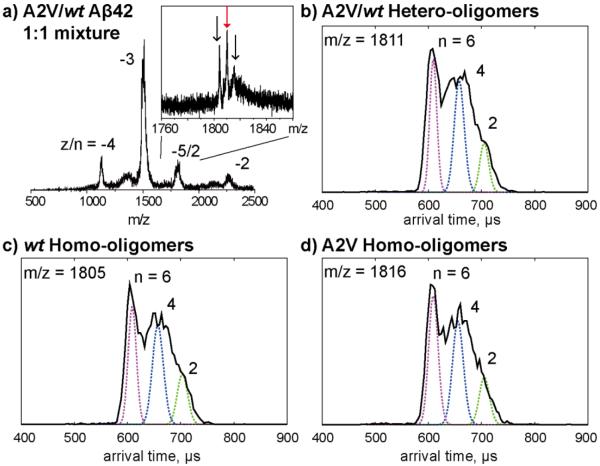
Figure 4.
Ion mobility study of an equimolar mixture of wt Aβ42 and A2V mutant. a) A full mass spectrum of A2V/wt Aβ42 mixture and a zoom-in spectrum of z/n = −5/2 peaks which contains three species which correspond to wt Aβ42 homo-oligomers, wt /A2V Aβ42 hetero-oligomers and A2V Aβ42 homo-oligomers. b-d) ATDs of the three −5/2 oligomer peaks. The oligomer order (n) is noted for each feature. The dashed lines represent the peak shape for a single conformation. The injection energy in panels b, c, and d is 40 eV.

