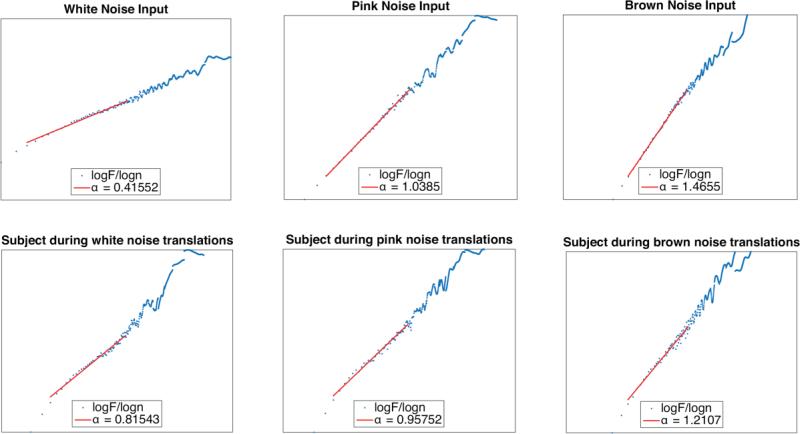
Figure 3.
Example log/log plots from running the DFA algorithm. The top row contains the log/log plots of the input signals and the bottom row contains the log/log plots of the COP signal during conditions where the support surface was translated with the waveforms from the top row. The red lines indicate the scaling region that was chosen for analysis and the alpha value is the slope of these lines.

