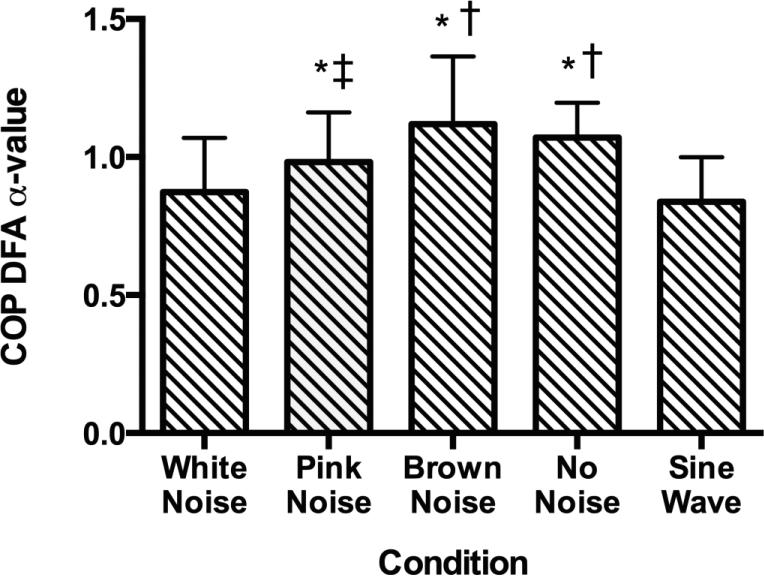
Figure 5.
DFA α-values for the five conditions. The “no noise” condition was placed within the noise conditions based on the model of optimal variability and knowing that the “no noise” condition was not different from the pink noise condition. Significant differences were found in the α-values when comparing both the sine wave and white noise conditions with the no noise, brown noise and pink noise conditions as well as when comparing the pink noise and brown noise conditions. * = P < .05 compared to the sine wave condition, † = P < .05 compared to the white noise condition, ‡ = P < .05 compared to the brown noise condition.

