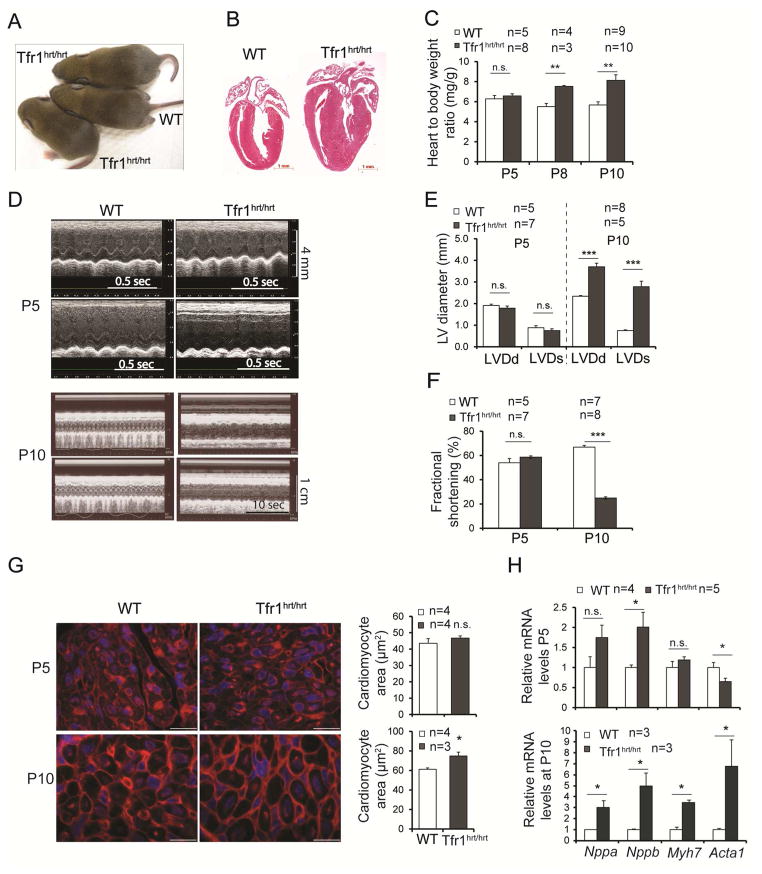
Figure 1. Loss of Tfr1 in cardiomyocytes causes cardiomyopathy.
(A) Tfr1hrt/hrt mice appeared grossly similar to WT at P10.
(B) H&E staining of heart sections at P10, demonstrating cardiomegaly in Tfr1hrt/hrt mice. Scale bars=1 mm.
(C) Tfr1hrt/hrt mice had normal heart to body ratios at P5, but cardiomegaly was apparent at P8 and P10.
(D) Echocardiograms from representative Tfr1hrt/hrt and WT littermates at P5 (top) and P10 (bottom). For each age, upper panel, short axis; lower panel, long axis. Tfr1hrt/hrt mice have markedly impaired cardiac function at P10.
(E) ,(F) Left ventricular diameter and fractional shortening were normal at P5 but abnormal in Tfr1hrt/hrt mice at P10. LVDd=left ventricular diameter in diastole; LVDs=left ventricular diameter in systole.
(G) Representative images of WGA staining for cardiomyocyte morphometrics and quantitation showing Tfr1hrt/hrt cardiomyocyte area similar to WT at P5 (top) and enlarged Tfr1hrt/hrt cardiomyocytes at P10 (bottom). Scale bars=15 μm.
(H) mRNA levels of cardiac hypertrophy biomarkers at P5 and P10 as described in the text.
Data are presented as means ± SEM. Sample size (n) is indicated. *p < 0.05; **p < 0.01; ***p<0.001 by one-way ANOVA. See also Figure S1.

