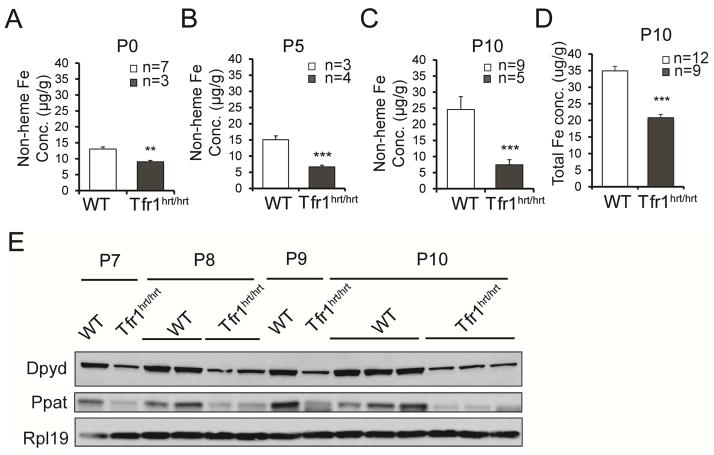
Figure 2. Iron deficiency and Fe-S cluster insufficiency in Tfr1hrt/hrt mice.
(A–C) Non-heme iron levels in WT and mutant heart at P0 (A), P5 (B) and P10 (C).
(D) Total iron concentration at P10.
(E) Decreased Fe-S cluster proteins Dpyd and Ppat in hearts from Tfr1hrt/hrt mice; Rpl19 control. Ages and genotypes are shown at the top.
Data are presented as means ± SEM. Sample size (n) is indicated. ***p<0.001 by one-way ANOVA.

