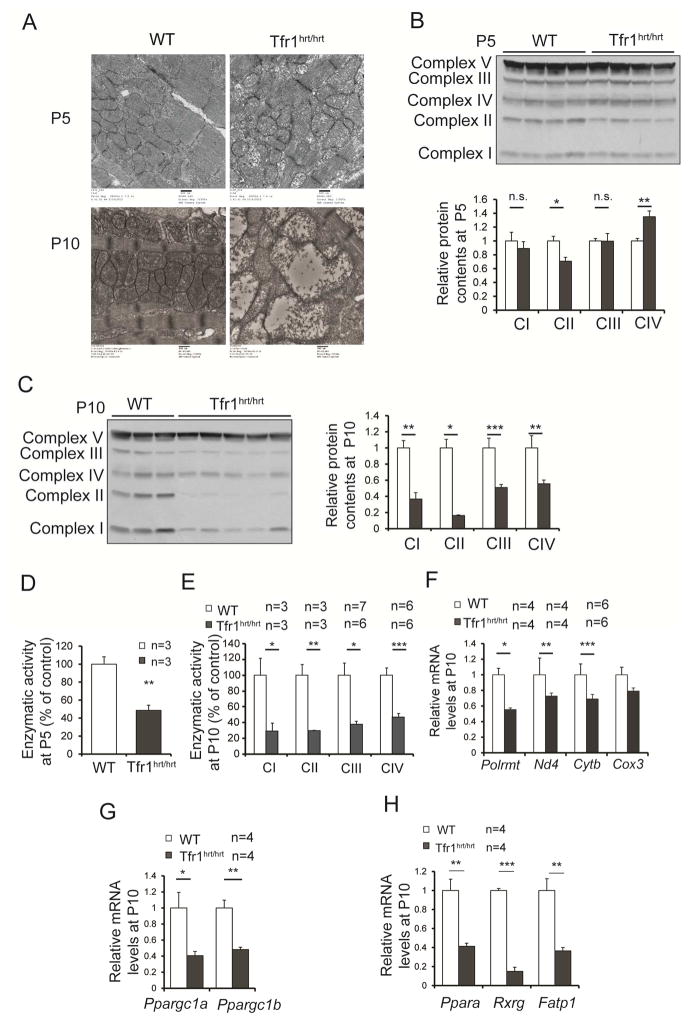
Figure 3. Abnormal mitochondrial morphology and function in hearts from Tfr1hrt/hrt mice.
(A) Electron micrographs comparing mitochondria in WT and Tfr1hrt/hrt hearts. Tfr1hrt/hrt mitochondria were slightly abnormal at P5 (top) but markedly enlarged and disrupted at P10 (bottom). Scale bars=500 nm.
(B) Representative protein levels for ETC complexes by immunoblot at P5 using complex V as the standard.
(C) Representative protein levels for ETC complexes by immunoblot at P10 using complex V as the standard.
(D) Enzymatic activity of complex II of ETC from P5 Tfr1hrt/hrt and WT littermates
(E) Enzymatic activity of complexes I to IV of ETC from P10 Tfr1hrt/hrt and WT littermates.
(F) Relative mRNA levels of Polrmt and mitochondria-encoded genes at P10.
(G) Relative mRNA levels of PGC1-α (Ppargc1a) and PGC1-β (Ppargc1b) at P10.
(H) Relative mRNA levels of PPARα (Ppara), Rxr gamma (Rxrg), and fatty acid transport protein (Fatp1) at P10.
Data are presented as means ± SEM. Sample size (n) is indicated. *p < 0.05; **p < 0.01; ***p<0.001 by one-way ANOVA. See also Figure S2.

