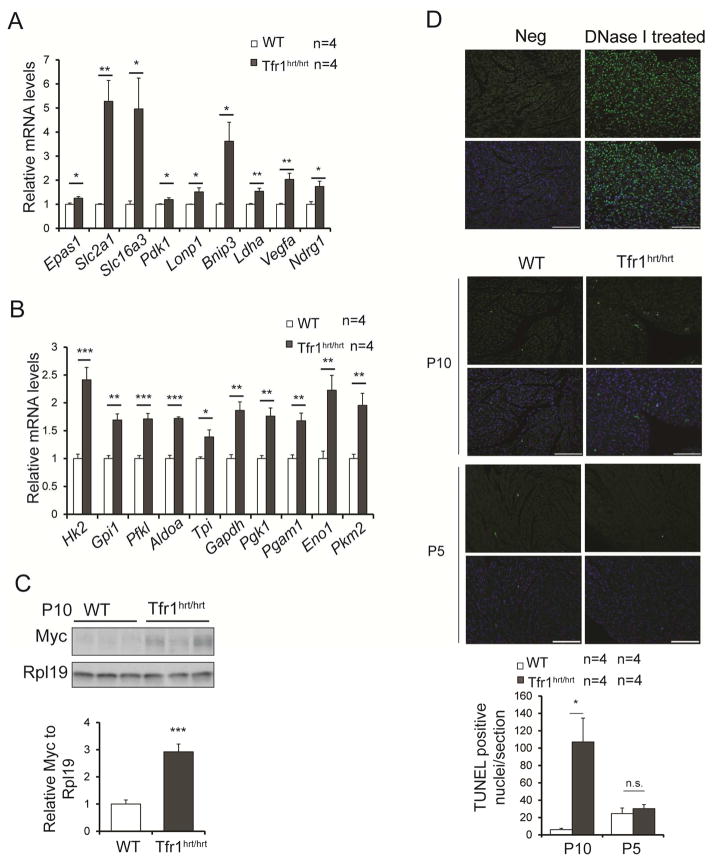
Figure 4. Metabolic changes and increased apoptosis in hearts from Tfr1hrt/hrt mice at P10.
(A) Relative mRNA levels of transcripts induced by hypoxia.
(B) Relative mRNA levels of transcripts encoding enzymes of glycolysis.
(C) Representative protein levels for Myc by immunoblot at P10.
(D) TUNEL staining for apoptosis at both P10 and P5. Top row without DAPI staining of nuclei; bottom row with DAPI staining. Vertical pairs of panels from left to right: negative control, positive control, WT and Tfr1hrt/hrt at P10 and P5 respectively. Bright green fluorescent nuclei represent apoptotic cells; scale bars=100 μm. Results are quantified on the right; data are presented as means ± SEM.
Sample size (n) is indicated;*p < 0.05; **p < 0.01; ***p<0.001 by one-way ANOVA. See also Figure S3.

