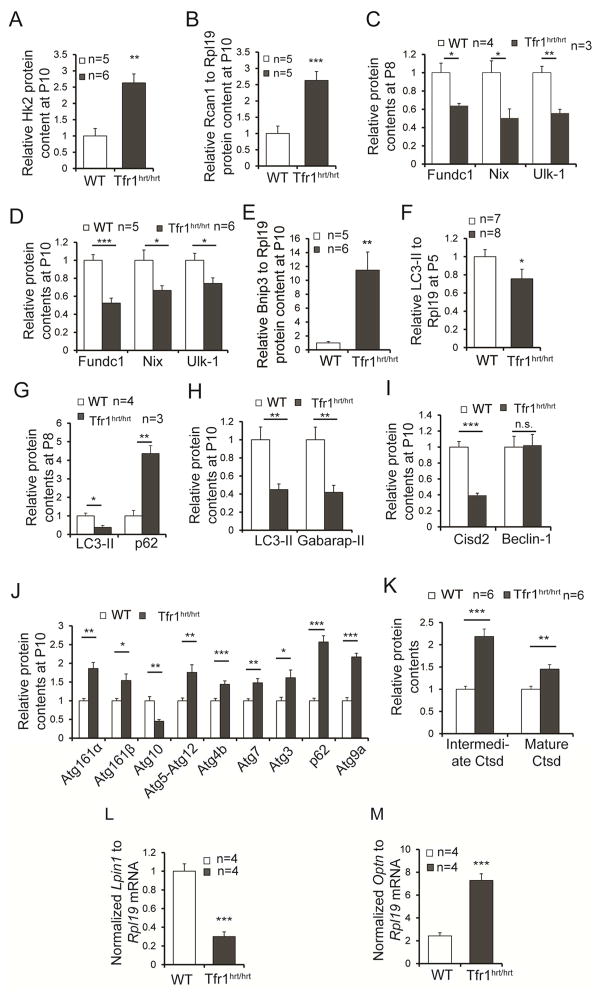
Figure 5. Altered expression of molecules involved in autophagy and mitophagy in hearts from Tfr1hrt/hrt mice.
Multiple autophagy- and mitophagy-related genes were examined in P10 (A,B,D,E,H–J), P8 (C,G), and P5 (F) heart samples for protein levels, as indicated in each panel. Differences suggested stimulation of autophagy but failure to complete autophagy in Tfr1hrt/hrt hearts. Sample sizes for WT and Tfr1hrt/hrt not shown in the figure panels: (H) 14 WT, 6 Tfr1hrt/hrt mice; (I) 3 WT and 5 Tfr1hrt/hrt mice for Cisd2; 5 mice each for Beclin1; (J) 5–6 mice of each genotype except for Atg4B (11 mice) and Atg3 (16 mice).
(K) Lysosomal cathepsin D (Ctsd) and its cleaved intermediate were elevated in hearts from Tfr1hrt/hrt mice, indicating normal lysosomal function.
(L) Lpin1 mRNA was decreased in hearts from Tfr1hrt/hrt mice.
(M) Optineurin (Optn) mRNA was increased in hearts from Tfr1hrt/hrt mice.
Data are presented as means ± SEM. Sample size (n) is indicated; *p < 0.05; **p < 0.01; ***p<0.001 by one-way ANOVA; n.s., not significant. See also Figure S4.

