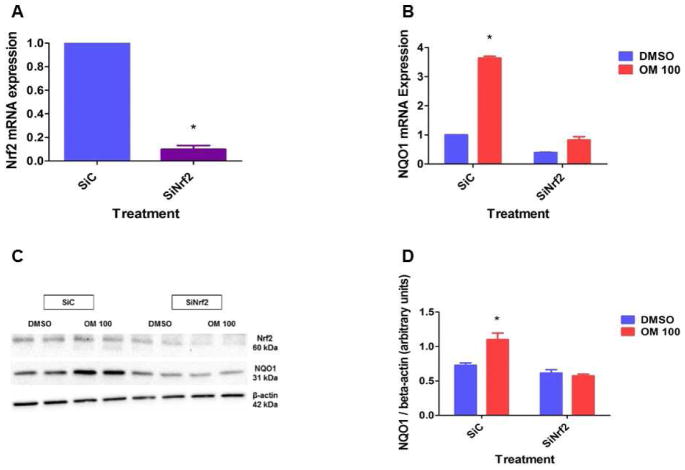
Figure 4. OM increases NQO1 expression in HPMEC via Nrf2-dependent mechanisms.
HPMEC were transfected with either 100 nM control (SiC) or Nrf2 (SiNrf2) siRNA. Twenty-four to forty-eight hours after transfection, RNA and whole-cell protein was extracted to determine Nrf2 mRNA (A) and protein (C) expression, respectively. Additionally, 24 h after transfection, the cells were treated with DMSO or OM for up to 48 h, following which RNA and whole-cell protein was extracted to determine NQO1 mRNA (B) and protein (C) expression, respectively. NQO1 band intensities were quantified and normalized to β-actin (D). Data are representative of at least three independent experiments. Values are presented as means ± SEM (n=3). Two-way ANOVA showed an effect of OM and Nrf2 gene and an interaction between them for the dependent variable, NQO1, in this figure. Significant differences between DMSO and OM-treated cells, and between control and Nrf2 siRNA-transfected cells are indicated by *.

