Figure 3.
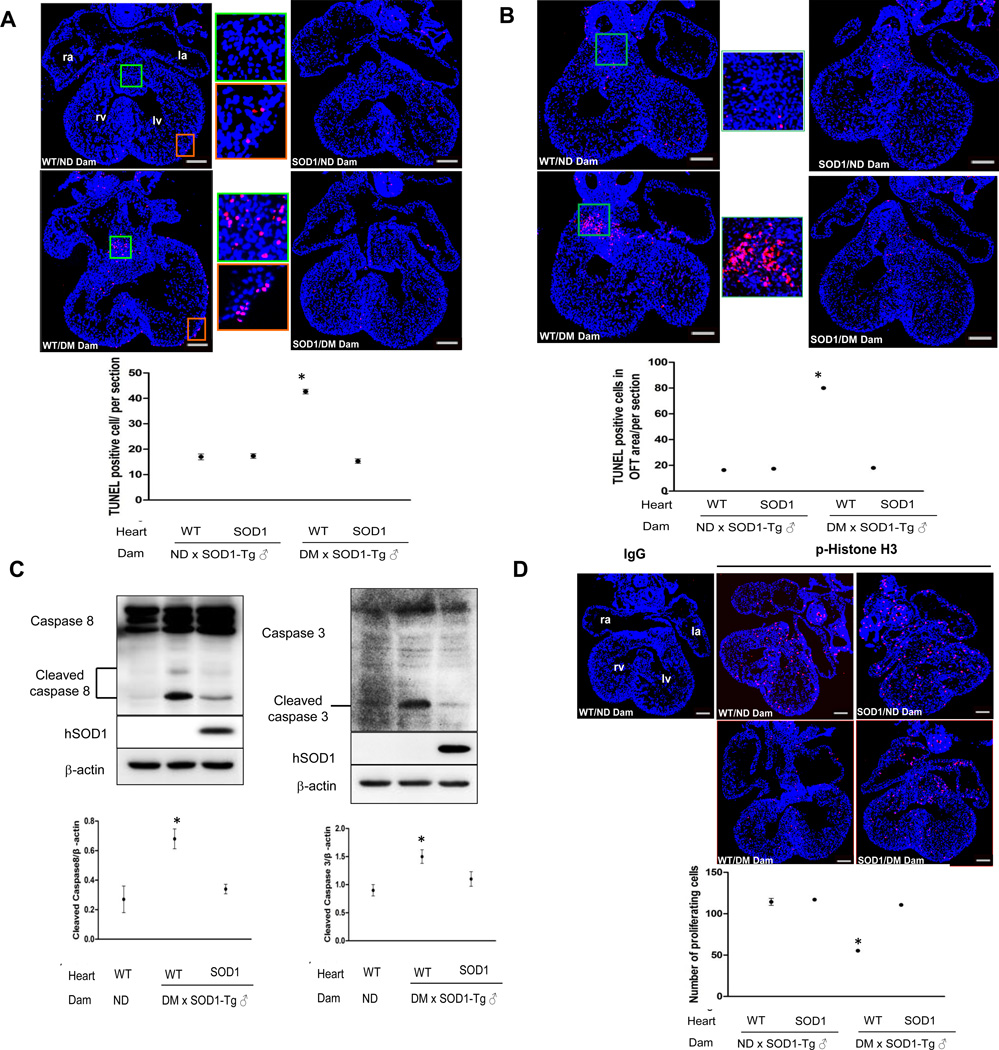
SOD1 overexpression suppresses maternal diabetes-induced cell apoptosis and caspase activation and normalizes cell proliferation in the developing heart. A and B, representative images of the TUNEL assay showing apoptotic cells (Red signal) and quantified as TUNEL positive cells per section (3 sections from 3 different hearts of each group). Cell nuclei were stained with DAPI (Blue). TUNEL positive cells in the A-V and outflow tract endocardial cushion are shown in A and B, respectively. In A, TUNEL positive cells are also seen in the epicardium lining the ventricle. Bars = 150 µm. C, representative western blot for detection of cleaved caspase 3, 8 and the quantification normalized to β-actin. Human SOD1 (hSOD1), the transgene product, was detected by a specific human SOD1 antibody. Experiments were repeated three times using hearts from embryos of three different dams (n = 3) per group. D, representative images of p-Histone H3 immunostaining, which labels proliferating cells. p-Histone H3 positive cells are labeled by red signal and cell nuclei are stained by DAPI (Blue). In the dot graph, p-Histone H3 positive cells were quantified by the NIH Image J software and expressed as number of cells per section. Three hearts from embryos of three dams (n = 3) per group, and three serial sections per heart were analyzed. Bars = 150 µm. IgG: normal rabbit IgG controls; WT: Wild-type; ND: nondiabetic; DM: diabetic mellitus. * indicates significant difference compared to other groups.

