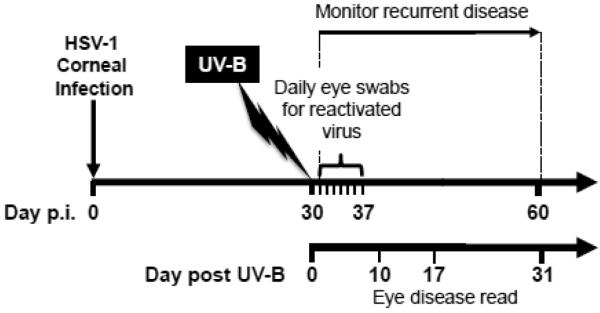
Figure 1. Schematic representation of the time line used in the UV-B model.

Mice were infected with HSV-1 as described in Materials & Methods closely adhering to the published model as shown in a video (Morris et al, 2012a). Tears were collected on the indicated days (days 0-7). Eye disease was scored on the indicated days (days 10, 17, 31).
