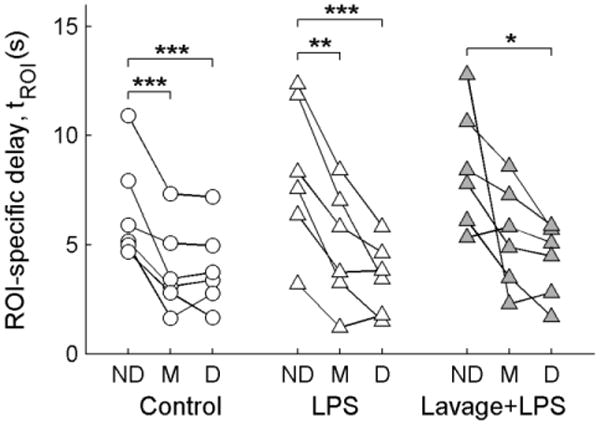
Fig. 4.

Distributions of ROI-specific delays derived with the delayed input function model. ROI delays (tROI) were computed by subtracting the pulmonary artery delay (tPA) from the total delay estimated from regional 18F-FDG kinetics (tdelay), according to Equation 3. A significant dependence of tROI on gravitational position was found (p<0.001), with the non-dependent (ND) regions showing higher delays than the middle (M) or dependent (D) regions in post-hoc tests. No significant differences were found between the Control, LPS, or Lavage + LPS conditions. *p<0.05, **p<0.01, ***p<0.001
