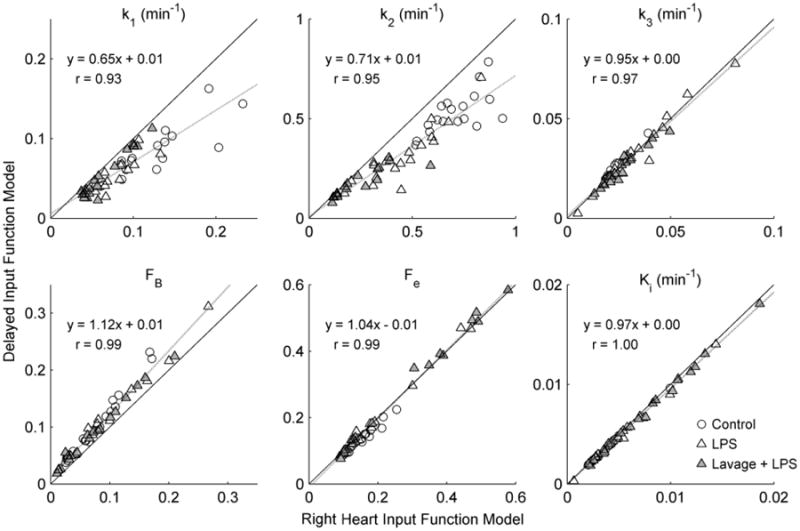
Fig. 6.

Comparison of 18F-FDG kinetics parameters estimated with the delayed input function and right heart input function models. Substantial differences between the models were observed for the parameters k1, k2, and FB, which are primarily determined by the early phase of 18F-FDG kinetics. The 18F-FDG net uptake rate Ki, phosphorylation rate k3, and volume of distribution Fe, were quite similar between the models, as data fell close to the line of identity
