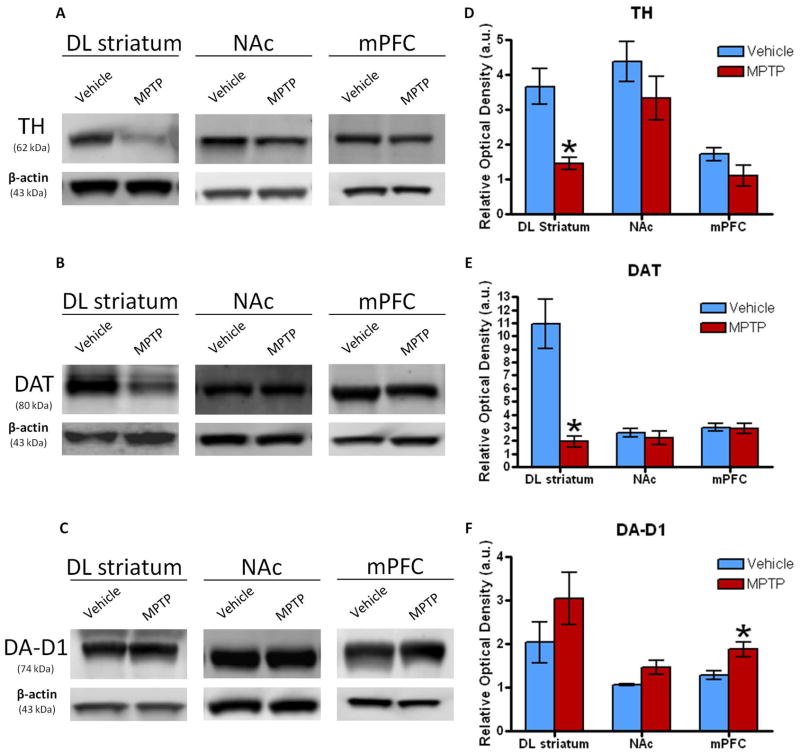
Figure 3. Western blot analysis of dopaminergic biomarkers.
Western blots showing the mean relative optical density of (A) TH, (B) DAT, and the (C) DA-D1 receptor protein expression within the DL striatum, NAc and mPFC following treatment with MPTP (n=6–7) or vehicle (n=5–6). (D) TH levels significantly decreased 62% compared to vehicle within the DL striatum in mice treated with MPTP. There was a similar trend in the NAc and mPFC though not significant. (E) DAT levels were significantly reduced by 83% compared to the vehicle only within the DL striatum of mice treated with MPTP. (F) DA-D1 expression increased 47% within the mPFC compared to the vehicle in MPTP treated mice. There were no differences in DA-D1 levels in the DL striatum or NAc even though they were trending with similar increases. Values are means ± S.E.M. *p<0.05.

