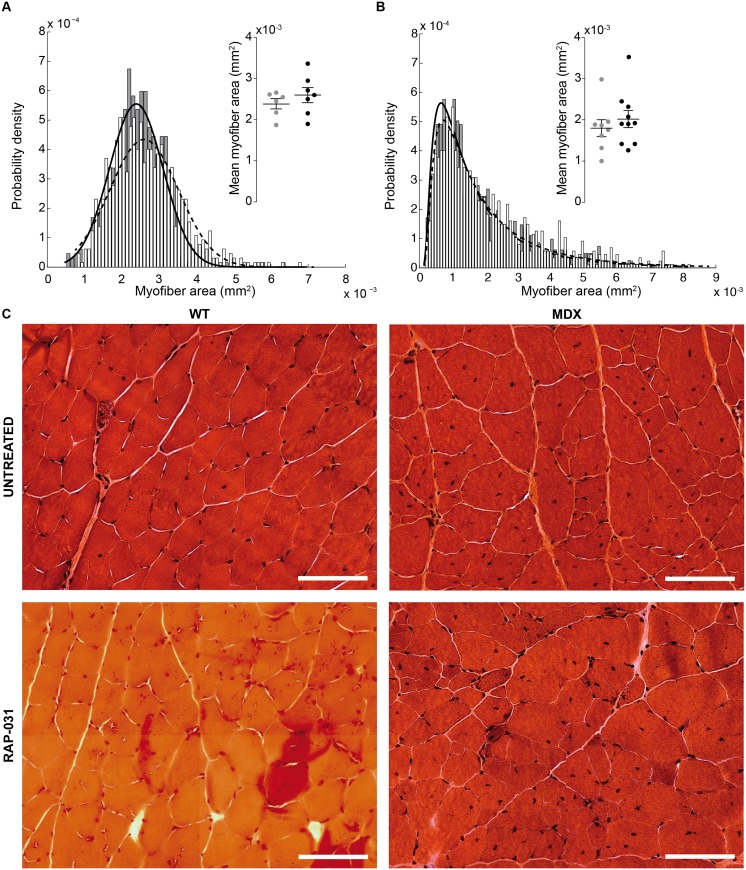
Fig 2. Wild-type (wt, A) and muscular distrophy (mdx, B) myofiber cross-sectional area distribution plot (1300 and 1800 myofibers respectively).
WT normal distribution mean and spread parameters: μm2, μm2, μm2, μm2. MDX inverse normal distribution mean μ and shape λ parameters: μm2, μm2, μm2, μm2. In detail, the distribution of the estimated mean values and (see S1 Table). The horizontal bars are the mean and standard error of the mean. Colors: gray dots, solid black line and gray bars, untreated; black dots, dashed black line and white bars, RAP−031. (C) Hematoxylin and eosin staining of gastrocnemius. The scale bar indicates 100 μm (40X magnification).

