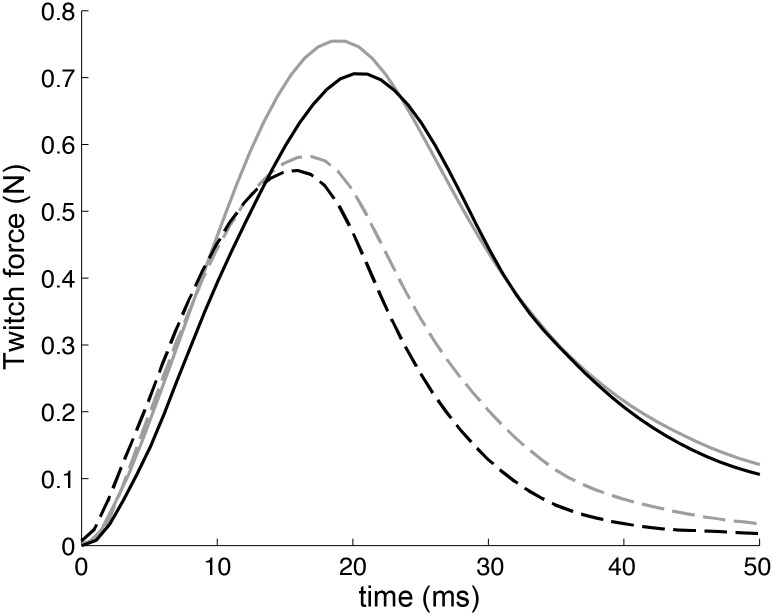
Fig 3. Examples of the qualitative differences in the time courses of isometric twitches induced by the treatment (data in Table 1).
In situ contraction force of the gastrocnemius muscle. Colors: gray, untreated; black, RAP-031. Groups: solid line, wild-type mice; dashed line, muscular dystrophy mice.

