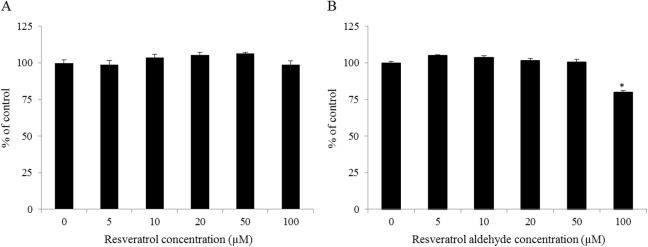
Fig 3. Caco-2/TC7 cell viability when different concentrations of resveratrol (A) or resveratrol aldehyde (B) were present in the medium.

Data are mean ± S.E. values of five replicates. Star indicates significant differences at P< 0.05 as determined by ANOVA, followed by the Tukey-Kramer test.
