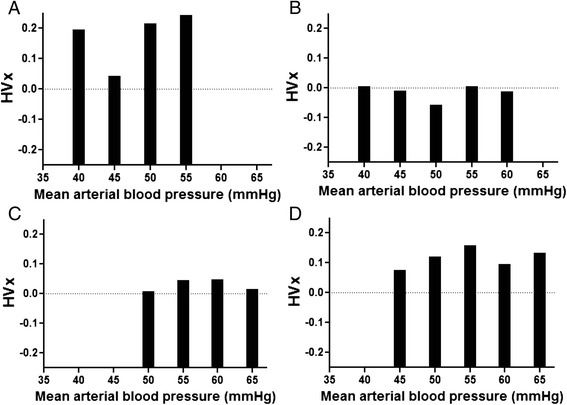
Fig. 1.

Representative hemoglobin volume index (HVx) bar graphs from individual neonates illustrate identification of the optimal mean arterial blood pressure (MAPOPT) at the nadir of HVx. MAPOPT values were 45 mmHg for patient 1 (a) and 50 mmHg for patient 2 (b). Patients 5 (c) and 25 (d) did not have a nadir in HVx and were therefore coded as having an unidentifiable MAPOPT
