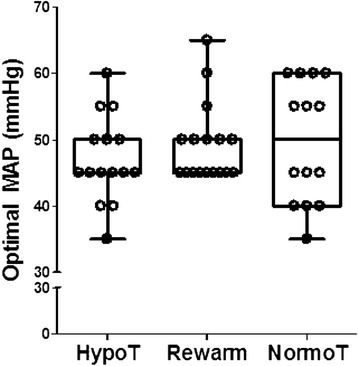
Fig. 2.

Optimal mean arterial blood pressure (MAP) values were similar during hypothermia (hypoT; n = 15), rewarming (rewarm; n = 17), and the first 6 h of normothermia (normoT; n = 14). p = 0.831 for hypothermia vs. rewarming; p = 0.313 for hypothermia vs. normothermia; p = 0.685 for rewarming vs. normothermia by Wilcoxon signed rank tests. Box plots with whiskers (5th–95th percentiles) are shown. Each circle represents one neonate
