
Fig. 3.
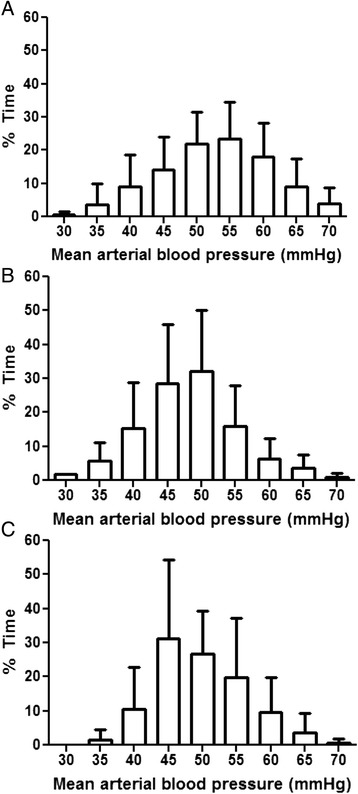
The percentages of time during hypothermia (n = 19; a), rewarming (n = 17; b), and normothermia (n = 16; c) that neonates spent at each level of mean arterial blood pressure. Data are shown as means with SDs
Official websites use .gov
A
.gov website belongs to an official
government organization in the United States.
Secure .gov websites use HTTPS
A lock (
) or https:// means you've safely
connected to the .gov website. Share sensitive
information only on official, secure websites.
The percentages of time during hypothermia (n = 19; a), rewarming (n = 17; b), and normothermia (n = 16; c) that neonates spent at each level of mean arterial blood pressure. Data are shown as means with SDs