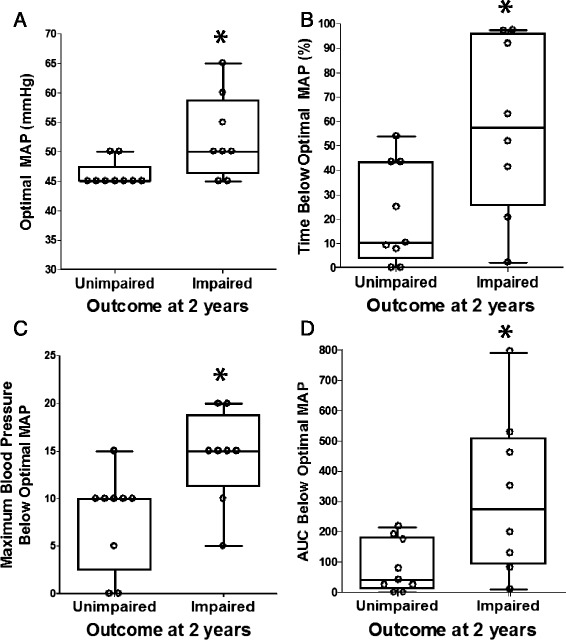
Fig. 4.

Optimal mean arterial blood pressure (MAP) and blood pressure below optimal MAP during the neonatal rewarming period in relation to neurodevelopmental outcome at approximately 2 years of age. In comparison to children without impairments (n = 9; unimpaired), children who developed impairments (n = 8; impaired) had higher optimal MAP values (*p = 0.023; a), spent a greater percentage of time with blood pressure below optimal MAP (*p = 0.048; b), had greater maximal blood pressure deviation below optimal MAP (*p = 0.019; c), and had greater area under the curve (AUC) below optimal MAP (*p = 0.039; d) during rewarming. Data were analyzed by Mann Whitney rank sum tests. Box plots with whiskers (5th–95th percentiles) are shown. Each circle represents one child
